class: inverse, center, middle # <svg aria-hidden="true" role="img" viewBox="0 0 192 512" style="height:1em;width:0.38em;vertical-align:-0.125em;margin-left:auto;margin-right:auto;font-size:inherit;fill:currentColor;overflow:visible;position:relative;"><path d="M144 80c0 26.5-21.5 48-48 48s-48-21.5-48-48s21.5-48 48-48s48 21.5 48 48zM0 224c0-17.7 14.3-32 32-32H96c17.7 0 32 14.3 32 32V448h32c17.7 0 32 14.3 32 32s-14.3 32-32 32H32c-17.7 0-32-14.3-32-32s14.3-32 32-32H64V256H32c-17.7 0-32-14.3-32-32z"/></svg> Minimal Shiny App ![:custom_hr]() --- # Minimal Shiny App <svg aria-hidden="true" role="img" viewBox="0 0 640 512" style="height:1em;width:1.25em;vertical-align:-0.125em;margin-left:auto;margin-right:auto;font-size:inherit;fill:currentColor;overflow:visible;position:relative;"><path d="M64 96c0-35.3 28.7-64 64-64H512c35.3 0 64 28.7 64 64V352H512V96H128V352H64V96zM0 403.2C0 392.6 8.6 384 19.2 384H620.8c10.6 0 19.2 8.6 19.2 19.2c0 42.4-34.4 76.8-76.8 76.8H76.8C34.4 480 0 445.6 0 403.2zM281 209l-31 31 31 31c9.4 9.4 9.4 24.6 0 33.9s-24.6 9.4-33.9 0l-48-48c-9.4-9.4-9.4-24.6 0-33.9l48-48c9.4-9.4 24.6-9.4 33.9 0s9.4 24.6 0 33.9zM393 175l48 48c9.4 9.4 9.4 24.6 0 33.9l-48 48c-9.4 9.4-24.6 9.4-33.9 0s-9.4-24.6 0-33.9l31-31-31-31c-9.4-9.4-9.4-24.6 0-33.9s24.6-9.4 33.9 0z"/></svg> [Simple shiny app](https://shiny.rstudio.com/gallery/single-file-shiny-app.html) .pull-left[ ```r # Global variables can go here n <- 200 # Define the UI ui <- bootstrapPage( numericInput('n', 'Number of obs', n), plotOutput('plot') ) # Define the server code server <- function(input, output) { output$plot <- renderPlot({ hist(runif(input$n)) }) } # Return a Shiny app object shinyApp(ui = ui, server = server) ``` ] .pull-right[ 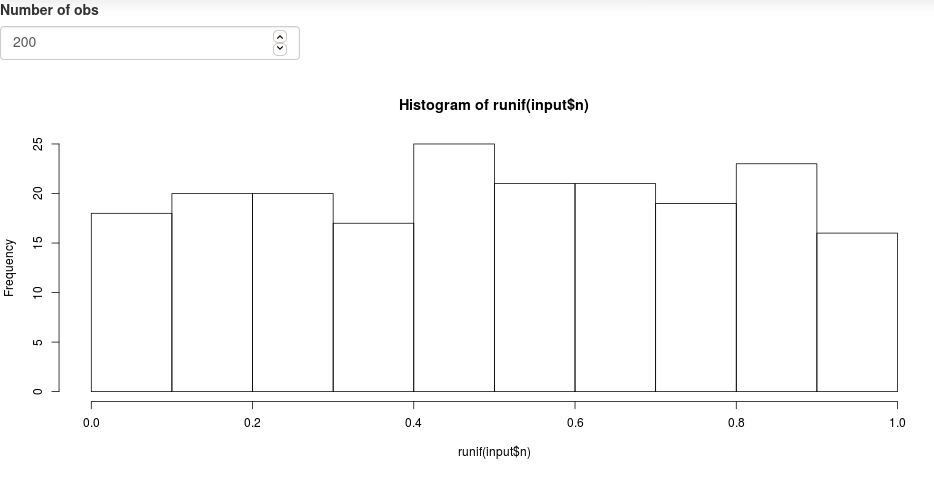 ] ??? So far we've looked at this simple app from a standpoint of reactive programming. Now we will look at it from the perspective of building a shiny app --- # Minimal Shiny App ## Structure - *Optional*: General environment -- - <svg aria-hidden="true" role="img" viewBox="0 0 576 512" style="height:1em;width:1.12em;vertical-align:-0.125em;margin-left:auto;margin-right:auto;font-size:inherit;fill:currentColor;overflow:visible;position:relative;"><path d="M160 256C160 185.3 217.3 128 288 128C358.7 128 416 185.3 416 256C416 326.7 358.7 384 288 384C217.3 384 160 326.7 160 256zM288 336C332.2 336 368 300.2 368 256C368 211.8 332.2 176 288 176C287.3 176 286.7 176 285.1 176C287.3 181.1 288 186.5 288 192C288 227.3 259.3 256 224 256C218.5 256 213.1 255.3 208 253.1C208 254.7 208 255.3 208 255.1C208 300.2 243.8 336 288 336L288 336zM95.42 112.6C142.5 68.84 207.2 32 288 32C368.8 32 433.5 68.84 480.6 112.6C527.4 156 558.7 207.1 573.5 243.7C576.8 251.6 576.8 260.4 573.5 268.3C558.7 304 527.4 355.1 480.6 399.4C433.5 443.2 368.8 480 288 480C207.2 480 142.5 443.2 95.42 399.4C48.62 355.1 17.34 304 2.461 268.3C-.8205 260.4-.8205 251.6 2.461 243.7C17.34 207.1 48.62 156 95.42 112.6V112.6zM288 80C222.8 80 169.2 109.6 128.1 147.7C89.6 183.5 63.02 225.1 49.44 256C63.02 286 89.6 328.5 128.1 364.3C169.2 402.4 222.8 432 288 432C353.2 432 406.8 402.4 447.9 364.3C486.4 328.5 512.1 286 526.6 256C512.1 225.1 486.4 183.5 447.9 147.7C406.8 109.6 353.2 80 288 80V80z"/></svg> User interface object `ui`: - Controls layout and appearance of the app (where to position the element to display) - Front end of the app - What the user sees and interacts with -- - <svg aria-hidden="true" role="img" viewBox="0 0 640 512" style="height:1em;width:1.25em;vertical-align:-0.125em;margin-left:auto;margin-right:auto;font-size:inherit;fill:currentColor;overflow:visible;position:relative;"><path d="M308.5 135.3c7.1-6.3 9.9-16.2 6.2-25c-2.3-5.3-4.8-10.5-7.6-15.5L304 89.4c-3-5-6.3-9.9-9.8-14.6c-5.7-7.6-15.7-10.1-24.7-7.1l-28.2 9.3c-10.7-8.8-23-16-36.2-20.9L199 27.1c-1.9-9.3-9.1-16.7-18.5-17.8C173.7 8.4 166.9 8 160 8s-13.7 .4-20.4 1.2c-9.4 1.1-16.6 8.6-18.5 17.8L115 56.1c-13.3 5-25.5 12.1-36.2 20.9L50.5 67.8c-9-3-19-.5-24.7 7.1c-3.5 4.7-6.8 9.6-9.9 14.6l-3 5.3c-2.8 5-5.3 10.2-7.6 15.6c-3.7 8.7-.9 18.6 6.2 25l22.2 19.8C32.6 161.9 32 168.9 32 176s.6 14.1 1.7 20.9L11.5 216.7c-7.1 6.3-9.9 16.2-6.2 25c2.3 5.3 4.8 10.5 7.6 15.6l3 5.2c3 5.1 6.3 9.9 9.9 14.6c5.7 7.6 15.7 10.1 24.7 7.1l28.2-9.3c10.7 8.8 23 16 36.2 20.9l6.1 29.1c1.9 9.3 9.1 16.7 18.5 17.8c6.7 .8 13.5 1.2 20.4 1.2s13.7-.4 20.4-1.2c9.4-1.1 16.6-8.6 18.5-17.8l6.1-29.1c13.3-5 25.5-12.1 36.2-20.9l28.2 9.3c9 3 19 .5 24.7-7.1c3.5-4.7 6.8-9.5 9.8-14.6l3.1-5.4c2.8-5 5.3-10.2 7.6-15.5c3.7-8.7 .9-18.6-6.2-25l-22.2-19.8c1.1-6.8 1.7-13.8 1.7-20.9s-.6-14.1-1.7-20.9l22.2-19.8zM208 176c0 26.5-21.5 48-48 48s-48-21.5-48-48s21.5-48 48-48s48 21.5 48 48zM504.7 500.5c6.3 7.1 16.2 9.9 25 6.2c5.3-2.3 10.5-4.8 15.5-7.6l5.4-3.1c5-3 9.9-6.3 14.6-9.8c7.6-5.7 10.1-15.7 7.1-24.7l-9.3-28.2c8.8-10.7 16-23 20.9-36.2l29.1-6.1c9.3-1.9 16.7-9.1 17.8-18.5c.8-6.7 1.2-13.5 1.2-20.4s-.4-13.7-1.2-20.4c-1.1-9.4-8.6-16.6-17.8-18.5L583.9 307c-5-13.3-12.1-25.5-20.9-36.2l9.3-28.2c3-9 .5-19-7.1-24.7c-4.7-3.5-9.6-6.8-14.6-9.9l-5.3-3c-5-2.8-10.2-5.3-15.6-7.6c-8.7-3.7-18.6-.9-25 6.2l-19.8 22.2c-6.8-1.1-13.8-1.7-20.9-1.7s-14.1 .6-20.9 1.7l-19.8-22.2c-6.3-7.1-16.2-9.9-25-6.2c-5.3 2.3-10.5 4.8-15.6 7.6l-5.2 3c-5.1 3-9.9 6.3-14.6 9.9c-7.6 5.7-10.1 15.7-7.1 24.7l9.3 28.2c-8.8 10.7-16 23-20.9 36.2L315.1 313c-9.3 1.9-16.7 9.1-17.8 18.5c-.8 6.7-1.2 13.5-1.2 20.4s.4 13.7 1.2 20.4c1.1 9.4 8.6 16.6 17.8 18.5l29.1 6.1c5 13.3 12.1 25.5 20.9 36.2l-9.3 28.2c-3 9-.5 19 7.1 24.7c4.7 3.5 9.5 6.8 14.6 9.8l5.4 3.1c5 2.8 10.2 5.3 15.5 7.6c8.7 3.7 18.6 .9 25-6.2l19.8-22.2c6.8 1.1 13.8 1.7 20.9 1.7s14.1-.6 20.9-1.7l19.8 22.2zM464 400c-26.5 0-48-21.5-48-48s21.5-48 48-48s48 21.5 48 48s-21.5 48-48 48z"/></svg> Server function `server`: - Instructions sent to the computer/server running R to build the app - Back end of the application -- - A call to the shinyApp function `shinyApp(ui, server)` --- # Minimal Shiy App: General environment ```r # Global variables can go here n <- 200 ``` - Located before the `ui` object and `server` function - Can be used to load any component that can be used by your app and needs to be loaded once only - Libraries - Data - Functions - These components should not affect your app efficiency once the app is loaded. --- # Minimal Shiny App: `ui` <svg aria-hidden="true" role="img" viewBox="0 0 576 512" style="height:1em;width:1.12em;vertical-align:-0.125em;margin-left:auto;margin-right:auto;font-size:inherit;fill:currentColor;overflow:visible;position:relative;"><path d="M160 256C160 185.3 217.3 128 288 128C358.7 128 416 185.3 416 256C416 326.7 358.7 384 288 384C217.3 384 160 326.7 160 256zM288 336C332.2 336 368 300.2 368 256C368 211.8 332.2 176 288 176C287.3 176 286.7 176 285.1 176C287.3 181.1 288 186.5 288 192C288 227.3 259.3 256 224 256C218.5 256 213.1 255.3 208 253.1C208 254.7 208 255.3 208 255.1C208 300.2 243.8 336 288 336L288 336zM95.42 112.6C142.5 68.84 207.2 32 288 32C368.8 32 433.5 68.84 480.6 112.6C527.4 156 558.7 207.1 573.5 243.7C576.8 251.6 576.8 260.4 573.5 268.3C558.7 304 527.4 355.1 480.6 399.4C433.5 443.2 368.8 480 288 480C207.2 480 142.5 443.2 95.42 399.4C48.62 355.1 17.34 304 2.461 268.3C-.8205 260.4-.8205 251.6 2.461 243.7C17.34 207.1 48.62 156 95.42 112.6V112.6zM288 80C222.8 80 169.2 109.6 128.1 147.7C89.6 183.5 63.02 225.1 49.44 256C63.02 286 89.6 328.5 128.1 364.3C169.2 402.4 222.8 432 288 432C353.2 432 406.8 402.4 447.9 364.3C486.4 328.5 512.1 286 526.6 256C512.1 225.1 486.4 183.5 447.9 147.7C406.8 109.6 353.2 80 288 80V80z"/></svg> ```r ui <- bootstrapPage( numericInput('n', 'Number of obs', n), plotOutput('plot') ) ``` -- 1. `ui` is the output of a function that creates a Shiny UI page (HTML), which defines the layout and its content. -- 2. layout: `bootstrapPage()` (see [Application layout guide](https://shiny.rstudio.com/articles/layout-guide.html)) -- 3. input: `numericInput()` (see [Control widget](https://shiny.rstudio.com/gallery/widget-gallery.html)) -- 4. output: `plotOutput()` (see [Display reactive output](https://shiny.rstudio.com/tutorial/written-tutorial/lesson4/)) -- 5. add HTML content with tags (see [Shiny HTML Tags Glossary](https://shiny.rstudio.com/articles/tag-glossary.html)) --- # Minimal Shiny App: `server` <svg aria-hidden="true" role="img" viewBox="0 0 640 512" style="height:1em;width:1.25em;vertical-align:-0.125em;margin-left:auto;margin-right:auto;font-size:inherit;fill:currentColor;overflow:visible;position:relative;"><path d="M308.5 135.3c7.1-6.3 9.9-16.2 6.2-25c-2.3-5.3-4.8-10.5-7.6-15.5L304 89.4c-3-5-6.3-9.9-9.8-14.6c-5.7-7.6-15.7-10.1-24.7-7.1l-28.2 9.3c-10.7-8.8-23-16-36.2-20.9L199 27.1c-1.9-9.3-9.1-16.7-18.5-17.8C173.7 8.4 166.9 8 160 8s-13.7 .4-20.4 1.2c-9.4 1.1-16.6 8.6-18.5 17.8L115 56.1c-13.3 5-25.5 12.1-36.2 20.9L50.5 67.8c-9-3-19-.5-24.7 7.1c-3.5 4.7-6.8 9.6-9.9 14.6l-3 5.3c-2.8 5-5.3 10.2-7.6 15.6c-3.7 8.7-.9 18.6 6.2 25l22.2 19.8C32.6 161.9 32 168.9 32 176s.6 14.1 1.7 20.9L11.5 216.7c-7.1 6.3-9.9 16.2-6.2 25c2.3 5.3 4.8 10.5 7.6 15.6l3 5.2c3 5.1 6.3 9.9 9.9 14.6c5.7 7.6 15.7 10.1 24.7 7.1l28.2-9.3c10.7 8.8 23 16 36.2 20.9l6.1 29.1c1.9 9.3 9.1 16.7 18.5 17.8c6.7 .8 13.5 1.2 20.4 1.2s13.7-.4 20.4-1.2c9.4-1.1 16.6-8.6 18.5-17.8l6.1-29.1c13.3-5 25.5-12.1 36.2-20.9l28.2 9.3c9 3 19 .5 24.7-7.1c3.5-4.7 6.8-9.5 9.8-14.6l3.1-5.4c2.8-5 5.3-10.2 7.6-15.5c3.7-8.7 .9-18.6-6.2-25l-22.2-19.8c1.1-6.8 1.7-13.8 1.7-20.9s-.6-14.1-1.7-20.9l22.2-19.8zM208 176c0 26.5-21.5 48-48 48s-48-21.5-48-48s21.5-48 48-48s48 21.5 48 48zM504.7 500.5c6.3 7.1 16.2 9.9 25 6.2c5.3-2.3 10.5-4.8 15.5-7.6l5.4-3.1c5-3 9.9-6.3 14.6-9.8c7.6-5.7 10.1-15.7 7.1-24.7l-9.3-28.2c8.8-10.7 16-23 20.9-36.2l29.1-6.1c9.3-1.9 16.7-9.1 17.8-18.5c.8-6.7 1.2-13.5 1.2-20.4s-.4-13.7-1.2-20.4c-1.1-9.4-8.6-16.6-17.8-18.5L583.9 307c-5-13.3-12.1-25.5-20.9-36.2l9.3-28.2c3-9 .5-19-7.1-24.7c-4.7-3.5-9.6-6.8-14.6-9.9l-5.3-3c-5-2.8-10.2-5.3-15.6-7.6c-8.7-3.7-18.6-.9-25 6.2l-19.8 22.2c-6.8-1.1-13.8-1.7-20.9-1.7s-14.1 .6-20.9 1.7l-19.8-22.2c-6.3-7.1-16.2-9.9-25-6.2c-5.3 2.3-10.5 4.8-15.6 7.6l-5.2 3c-5.1 3-9.9 6.3-14.6 9.9c-7.6 5.7-10.1 15.7-7.1 24.7l9.3 28.2c-8.8 10.7-16 23-20.9 36.2L315.1 313c-9.3 1.9-16.7 9.1-17.8 18.5c-.8 6.7-1.2 13.5-1.2 20.4s.4 13.7 1.2 20.4c1.1 9.4 8.6 16.6 17.8 18.5l29.1 6.1c5 13.3 12.1 25.5 20.9 36.2l-9.3 28.2c-3 9-.5 19 7.1 24.7c4.7 3.5 9.5 6.8 14.6 9.8l5.4 3.1c5 2.8 10.2 5.3 15.5 7.6c8.7 3.7 18.6 .9 25-6.2l19.8-22.2c6.8 1.1 13.8 1.7 20.9 1.7s14.1-.6 20.9-1.7l19.8 22.2zM464 400c-26.5 0-48-21.5-48-48s21.5-48 48-48s48 21.5 48 48s-21.5 48-48 48z"/></svg> ```r server <- function(input, output) { output$plot <- renderPlot({ hist(runif(input$n)) }) } ``` -- 1. server is a function of `input` and `output` and optionally `session` (used latter, but not covered, see [Session object](https://shiny.rstudio.com/reference/shiny/1.6.0/session.html)) 2. process output: `renderPlot()` (see [Display reactive output](https://shiny.rstudio.com/tutorial/written-tutorial/lesson4/)) <svg aria-hidden="true" role="img" viewBox="0 0 512 512" style="height:1em;width:1em;vertical-align:-0.125em;margin-left:auto;margin-right:auto;font-size:inherit;fill:currentColor;overflow:visible;position:relative;"><path d="M256 32c14.2 0 27.3 7.5 34.5 19.8l216 368c7.3 12.4 7.3 27.7 .2 40.1S486.3 480 472 480H40c-14.3 0-27.6-7.7-34.7-20.1s-7-27.8 .2-40.1l216-368C228.7 39.5 241.8 32 256 32zm0 128c-13.3 0-24 10.7-24 24V296c0 13.3 10.7 24 24 24s24-10.7 24-24V184c0-13.3-10.7-24-24-24zm32 224c0-17.7-14.3-32-32-32s-32 14.3-32 32s14.3 32 32 32s32-14.3 32-32z"/></svg> all `render*()` functions render reactive **output**, they capture R expressions and perform some light pre-processing to make the object suitable for the corresponding `*Output()` function in `ui`. --- # Minimal Shiny App: `server` <svg aria-hidden="true" role="img" viewBox="0 0 640 512" style="height:1em;width:1.25em;vertical-align:-0.125em;margin-left:auto;margin-right:auto;font-size:inherit;fill:currentColor;overflow:visible;position:relative;"><path d="M308.5 135.3c7.1-6.3 9.9-16.2 6.2-25c-2.3-5.3-4.8-10.5-7.6-15.5L304 89.4c-3-5-6.3-9.9-9.8-14.6c-5.7-7.6-15.7-10.1-24.7-7.1l-28.2 9.3c-10.7-8.8-23-16-36.2-20.9L199 27.1c-1.9-9.3-9.1-16.7-18.5-17.8C173.7 8.4 166.9 8 160 8s-13.7 .4-20.4 1.2c-9.4 1.1-16.6 8.6-18.5 17.8L115 56.1c-13.3 5-25.5 12.1-36.2 20.9L50.5 67.8c-9-3-19-.5-24.7 7.1c-3.5 4.7-6.8 9.6-9.9 14.6l-3 5.3c-2.8 5-5.3 10.2-7.6 15.6c-3.7 8.7-.9 18.6 6.2 25l22.2 19.8C32.6 161.9 32 168.9 32 176s.6 14.1 1.7 20.9L11.5 216.7c-7.1 6.3-9.9 16.2-6.2 25c2.3 5.3 4.8 10.5 7.6 15.6l3 5.2c3 5.1 6.3 9.9 9.9 14.6c5.7 7.6 15.7 10.1 24.7 7.1l28.2-9.3c10.7 8.8 23 16 36.2 20.9l6.1 29.1c1.9 9.3 9.1 16.7 18.5 17.8c6.7 .8 13.5 1.2 20.4 1.2s13.7-.4 20.4-1.2c9.4-1.1 16.6-8.6 18.5-17.8l6.1-29.1c13.3-5 25.5-12.1 36.2-20.9l28.2 9.3c9 3 19 .5 24.7-7.1c3.5-4.7 6.8-9.5 9.8-14.6l3.1-5.4c2.8-5 5.3-10.2 7.6-15.5c3.7-8.7 .9-18.6-6.2-25l-22.2-19.8c1.1-6.8 1.7-13.8 1.7-20.9s-.6-14.1-1.7-20.9l22.2-19.8zM208 176c0 26.5-21.5 48-48 48s-48-21.5-48-48s21.5-48 48-48s48 21.5 48 48zM504.7 500.5c6.3 7.1 16.2 9.9 25 6.2c5.3-2.3 10.5-4.8 15.5-7.6l5.4-3.1c5-3 9.9-6.3 14.6-9.8c7.6-5.7 10.1-15.7 7.1-24.7l-9.3-28.2c8.8-10.7 16-23 20.9-36.2l29.1-6.1c9.3-1.9 16.7-9.1 17.8-18.5c.8-6.7 1.2-13.5 1.2-20.4s-.4-13.7-1.2-20.4c-1.1-9.4-8.6-16.6-17.8-18.5L583.9 307c-5-13.3-12.1-25.5-20.9-36.2l9.3-28.2c3-9 .5-19-7.1-24.7c-4.7-3.5-9.6-6.8-14.6-9.9l-5.3-3c-5-2.8-10.2-5.3-15.6-7.6c-8.7-3.7-18.6-.9-25 6.2l-19.8 22.2c-6.8-1.1-13.8-1.7-20.9-1.7s-14.1 .6-20.9 1.7l-19.8-22.2c-6.3-7.1-16.2-9.9-25-6.2c-5.3 2.3-10.5 4.8-15.6 7.6l-5.2 3c-5.1 3-9.9 6.3-14.6 9.9c-7.6 5.7-10.1 15.7-7.1 24.7l9.3 28.2c-8.8 10.7-16 23-20.9 36.2L315.1 313c-9.3 1.9-16.7 9.1-17.8 18.5c-.8 6.7-1.2 13.5-1.2 20.4s.4 13.7 1.2 20.4c1.1 9.4 8.6 16.6 17.8 18.5l29.1 6.1c5 13.3 12.1 25.5 20.9 36.2l-9.3 28.2c-3 9-.5 19 7.1 24.7c4.7 3.5 9.5 6.8 14.6 9.8l5.4 3.1c5 2.8 10.2 5.3 15.5 7.6c8.7 3.7 18.6 .9 25-6.2l19.8-22.2c6.8 1.1 13.8 1.7 20.9 1.7s14.1-.6 20.9-1.7l19.8 22.2zM464 400c-26.5 0-48-21.5-48-48s21.5-48 48-48s48 21.5 48 48s-21.5 48-48 48z"/></svg> ## [Reactive output](https://shiny.rstudio.com/tutorial/written-tutorial/lesson4/) .font90[ | Output function (`ui`) | Render function (`server`) | Creates | | :--------------------- | :------------------------- | :-----------| | `dataTableOutput` | `renderDataTable()` | DataTable | | `htmlOutput` | `renderImage()` | raw HTML | | `imageOutput` | `renderImage()` | image | | `plotOutput` | `renderPlot()` | plot | | `tableOutput` | `renderTable()` | table | | `textOutput` | `renderText()` | text | | `uiOutput` | `renderUI()` | raw HTML | | `verbatimTextOutput` | `renderVerbatimText()` | text | ] --- # Minimal Shiny App: inputs & outputs ### <svg aria-hidden="true" role="img" viewBox="0 0 192 512" style="height:1em;width:0.38em;vertical-align:-0.125em;margin-left:auto;margin-right:auto;font-size:inherit;fill:currentColor;overflow:visible;position:relative;"><path d="M144 80c0 26.5-21.5 48-48 48s-48-21.5-48-48s21.5-48 48-48s48 21.5 48 48zM0 224c0-17.7 14.3-32 32-32H96c17.7 0 32 14.3 32 32V448h32c17.7 0 32 14.3 32 32s-14.3 32-32 32H32c-17.7 0-32-14.3-32-32s14.3-32 32-32H64V256H32c-17.7 0-32-14.3-32-32z"/></svg> Be aware of ***ids*** ```r numericInput('n', 'Number of obs', n) ``` --- # Minimal Shiny App: inputs & outputs ### <svg aria-hidden="true" role="img" viewBox="0 0 192 512" style="height:1em;width:0.38em;vertical-align:-0.125em;margin-left:auto;margin-right:auto;font-size:inherit;fill:currentColor;overflow:visible;position:relative;"><path d="M144 80c0 26.5-21.5 48-48 48s-48-21.5-48-48s21.5-48 48-48s48 21.5 48 48zM0 224c0-17.7 14.3-32 32-32H96c17.7 0 32 14.3 32 32V448h32c17.7 0 32 14.3 32 32s-14.3 32-32 32H32c-17.7 0-32-14.3-32-32s14.3-32 32-32H64V256H32c-17.7 0-32-14.3-32-32z"/></svg> Be aware of ***ids*** ```r numericInput(inputId = 'n', label = 'Number of obs', value = n) ``` -- ### Typical inputs ```r whateverInput(inputId = "id", value = "val", ...) ``` -- - Creates a list object called `input` with `inputId` as vectors containing the elements chosen by the user that can be used by the server to update displayed elements. ```r input <- list(id = 'val') input$id > "val" ``` --- # Minimal Shiny App: inputs & outputs ### <svg aria-hidden="true" role="img" viewBox="0 0 192 512" style="height:1em;width:0.38em;vertical-align:-0.125em;margin-left:auto;margin-right:auto;font-size:inherit;fill:currentColor;overflow:visible;position:relative;"><path d="M144 80c0 26.5-21.5 48-48 48s-48-21.5-48-48s21.5-48 48-48s48 21.5 48 48zM0 224c0-17.7 14.3-32 32-32H96c17.7 0 32 14.3 32 32V448h32c17.7 0 32 14.3 32 32s-14.3 32-32 32H32c-17.7 0-32-14.3-32-32s14.3-32 32-32H64V256H32c-17.7 0-32-14.3-32-32z"/></svg> Be aware of ***ids*** ```r plotOutput('plot') ``` --- # Minimal Shiny App: inputs & outputs ### <svg aria-hidden="true" role="img" viewBox="0 0 192 512" style="height:1em;width:0.38em;vertical-align:-0.125em;margin-left:auto;margin-right:auto;font-size:inherit;fill:currentColor;overflow:visible;position:relative;"><path d="M144 80c0 26.5-21.5 48-48 48s-48-21.5-48-48s21.5-48 48-48s48 21.5 48 48zM0 224c0-17.7 14.3-32 32-32H96c17.7 0 32 14.3 32 32V448h32c17.7 0 32 14.3 32 32s-14.3 32-32 32H32c-17.7 0-32-14.3-32-32s14.3-32 32-32H64V256H32c-17.7 0-32-14.3-32-32z"/></svg> Be aware of ***ids*** ```r plotOutput(outputId = 'plot') ``` -- ### Typical outputs .pull-left[ `ui` <svg aria-hidden="true" role="img" viewBox="0 0 576 512" style="height:1em;width:1.12em;vertical-align:-0.125em;margin-left:auto;margin-right:auto;font-size:inherit;fill:currentColor;overflow:visible;position:relative;"><path d="M160 256C160 185.3 217.3 128 288 128C358.7 128 416 185.3 416 256C416 326.7 358.7 384 288 384C217.3 384 160 326.7 160 256zM288 336C332.2 336 368 300.2 368 256C368 211.8 332.2 176 288 176C287.3 176 286.7 176 285.1 176C287.3 181.1 288 186.5 288 192C288 227.3 259.3 256 224 256C218.5 256 213.1 255.3 208 253.1C208 254.7 208 255.3 208 255.1C208 300.2 243.8 336 288 336L288 336zM95.42 112.6C142.5 68.84 207.2 32 288 32C368.8 32 433.5 68.84 480.6 112.6C527.4 156 558.7 207.1 573.5 243.7C576.8 251.6 576.8 260.4 573.5 268.3C558.7 304 527.4 355.1 480.6 399.4C433.5 443.2 368.8 480 288 480C207.2 480 142.5 443.2 95.42 399.4C48.62 355.1 17.34 304 2.461 268.3C-.8205 260.4-.8205 251.6 2.461 243.7C17.34 207.1 48.62 156 95.42 112.6V112.6zM288 80C222.8 80 169.2 109.6 128.1 147.7C89.6 183.5 63.02 225.1 49.44 256C63.02 286 89.6 328.5 128.1 364.3C169.2 402.4 222.8 432 288 432C353.2 432 406.8 402.4 447.9 364.3C486.4 328.5 512.1 286 526.6 256C512.1 225.1 486.4 183.5 447.9 147.7C406.8 109.6 353.2 80 288 80V80z"/></svg> ```r whateverOutput(inputId = "id", ...) ``` ] .pull-right[ `server` <svg aria-hidden="true" role="img" viewBox="0 0 640 512" style="height:1em;width:1.25em;vertical-align:-0.125em;margin-left:auto;margin-right:auto;font-size:inherit;fill:currentColor;overflow:visible;position:relative;"><path d="M308.5 135.3c7.1-6.3 9.9-16.2 6.2-25c-2.3-5.3-4.8-10.5-7.6-15.5L304 89.4c-3-5-6.3-9.9-9.8-14.6c-5.7-7.6-15.7-10.1-24.7-7.1l-28.2 9.3c-10.7-8.8-23-16-36.2-20.9L199 27.1c-1.9-9.3-9.1-16.7-18.5-17.8C173.7 8.4 166.9 8 160 8s-13.7 .4-20.4 1.2c-9.4 1.1-16.6 8.6-18.5 17.8L115 56.1c-13.3 5-25.5 12.1-36.2 20.9L50.5 67.8c-9-3-19-.5-24.7 7.1c-3.5 4.7-6.8 9.6-9.9 14.6l-3 5.3c-2.8 5-5.3 10.2-7.6 15.6c-3.7 8.7-.9 18.6 6.2 25l22.2 19.8C32.6 161.9 32 168.9 32 176s.6 14.1 1.7 20.9L11.5 216.7c-7.1 6.3-9.9 16.2-6.2 25c2.3 5.3 4.8 10.5 7.6 15.6l3 5.2c3 5.1 6.3 9.9 9.9 14.6c5.7 7.6 15.7 10.1 24.7 7.1l28.2-9.3c10.7 8.8 23 16 36.2 20.9l6.1 29.1c1.9 9.3 9.1 16.7 18.5 17.8c6.7 .8 13.5 1.2 20.4 1.2s13.7-.4 20.4-1.2c9.4-1.1 16.6-8.6 18.5-17.8l6.1-29.1c13.3-5 25.5-12.1 36.2-20.9l28.2 9.3c9 3 19 .5 24.7-7.1c3.5-4.7 6.8-9.5 9.8-14.6l3.1-5.4c2.8-5 5.3-10.2 7.6-15.5c3.7-8.7 .9-18.6-6.2-25l-22.2-19.8c1.1-6.8 1.7-13.8 1.7-20.9s-.6-14.1-1.7-20.9l22.2-19.8zM208 176c0 26.5-21.5 48-48 48s-48-21.5-48-48s21.5-48 48-48s48 21.5 48 48zM504.7 500.5c6.3 7.1 16.2 9.9 25 6.2c5.3-2.3 10.5-4.8 15.5-7.6l5.4-3.1c5-3 9.9-6.3 14.6-9.8c7.6-5.7 10.1-15.7 7.1-24.7l-9.3-28.2c8.8-10.7 16-23 20.9-36.2l29.1-6.1c9.3-1.9 16.7-9.1 17.8-18.5c.8-6.7 1.2-13.5 1.2-20.4s-.4-13.7-1.2-20.4c-1.1-9.4-8.6-16.6-17.8-18.5L583.9 307c-5-13.3-12.1-25.5-20.9-36.2l9.3-28.2c3-9 .5-19-7.1-24.7c-4.7-3.5-9.6-6.8-14.6-9.9l-5.3-3c-5-2.8-10.2-5.3-15.6-7.6c-8.7-3.7-18.6-.9-25 6.2l-19.8 22.2c-6.8-1.1-13.8-1.7-20.9-1.7s-14.1 .6-20.9 1.7l-19.8-22.2c-6.3-7.1-16.2-9.9-25-6.2c-5.3 2.3-10.5 4.8-15.6 7.6l-5.2 3c-5.1 3-9.9 6.3-14.6 9.9c-7.6 5.7-10.1 15.7-7.1 24.7l9.3 28.2c-8.8 10.7-16 23-20.9 36.2L315.1 313c-9.3 1.9-16.7 9.1-17.8 18.5c-.8 6.7-1.2 13.5-1.2 20.4s.4 13.7 1.2 20.4c1.1 9.4 8.6 16.6 17.8 18.5l29.1 6.1c5 13.3 12.1 25.5 20.9 36.2l-9.3 28.2c-3 9-.5 19 7.1 24.7c4.7 3.5 9.5 6.8 14.6 9.8l5.4 3.1c5 2.8 10.2 5.3 15.5 7.6c8.7 3.7 18.6 .9 25-6.2l19.8-22.2c6.8 1.1 13.8 1.7 20.9 1.7s14.1-.6 20.9-1.7l19.8 22.2zM464 400c-26.5 0-48-21.5-48-48s21.5-48 48-48s48 21.5 48 48s-21.5 48-48 48z"/></svg> ```r output$id <- renderWhatever(...) ``` ] --- # Minimal Shiny App: run the app ```r shinyApp(ui = ui, server = server) ``` <svg aria-hidden="true" role="img" viewBox="0 0 640 512" style="height:1em;width:1.25em;vertical-align:-0.125em;margin-left:auto;margin-right:auto;font-size:inherit;fill:currentColor;overflow:visible;position:relative;"><path d="M64 96c0-35.3 28.7-64 64-64H512c35.3 0 64 28.7 64 64V352H512V96H128V352H64V96zM0 403.2C0 392.6 8.6 384 19.2 384H620.8c10.6 0 19.2 8.6 19.2 19.2c0 42.4-34.4 76.8-76.8 76.8H76.8C34.4 480 0 445.6 0 403.2zM281 209l-31 31 31 31c9.4 9.4 9.4 24.6 0 33.9s-24.6 9.4-33.9 0l-48-48c-9.4-9.4-9.4-24.6 0-33.9l48-48c9.4-9.4 24.6-9.4 33.9 0s9.4 24.6 0 33.9zM393 175l48 48c9.4 9.4 9.4 24.6 0 33.9l-48 48c-9.4 9.4-24.6 9.4-33.9 0s-9.4-24.6 0-33.9l31-31-31-31c-9.4-9.4-9.4-24.6 0-33.9s24.6-9.4 33.9 0z"/></svg> Trigger the application. -- There are several ways to do so, see [App formats and launching apps](https://shiny.rstudio.com/articles/app-formats.html). --- # Minimal Shiny App: create a project .pull-left[ ***From scratch***: - Create a project folder - Add code in a script called `app.R` - Fire up R and load Shiny package - Run the app! ```r shiny::runApp("app.R") ``` ] --- # Minimal Shiny App: create a project .pull-left[ ***From scratch***: - Create a project folder - Add code in a script called `app.R` - Fire up R and load Shiny package - Run the app! ```r shiny::runApp("app.R") ``` ] .pull-right[ ***Using <svg aria-hidden="true" role="img" viewBox="0 0 581 512" style="height:1em;width:1.13em;vertical-align:-0.125em;margin-left:auto;margin-right:auto;font-size:inherit;fill:currentColor;overflow:visible;position:relative;"><path d="M581 226.6C581 119.1 450.9 32 290.5 32S0 119.1 0 226.6C0 322.4 103.3 402 239.4 418.1V480h99.1v-61.5c24.3-2.7 47.6-7.4 69.4-13.9L448 480h112l-67.4-113.7c54.5-35.4 88.4-84.9 88.4-139.7zm-466.8 14.5c0-73.5 98.9-133 220.8-133s211.9 40.7 211.9 133c0 50.1-26.5 85-70.3 106.4-2.4-1.6-4.7-2.9-6.4-3.7-10.2-5.2-27.8-10.5-27.8-10.5s86.6-6.4 86.6-92.7-90.6-87.9-90.6-87.9h-199V361c-74.1-21.5-125.2-67.1-125.2-119.9zm225.1 38.3v-55.6c57.8 0 87.8-6.8 87.8 27.3 0 36.5-38.2 28.3-87.8 28.3zm-.9 72.5H365c10.8 0 18.9 11.7 24 19.2-16.1 1.9-33 2.8-50.6 2.9v-22.1z"/></svg> Studio***: - Open <svg aria-hidden="true" role="img" viewBox="0 0 581 512" style="height:1em;width:1.13em;vertical-align:-0.125em;margin-left:auto;margin-right:auto;font-size:inherit;fill:currentColor;overflow:visible;position:relative;"><path d="M581 226.6C581 119.1 450.9 32 290.5 32S0 119.1 0 226.6C0 322.4 103.3 402 239.4 418.1V480h99.1v-61.5c24.3-2.7 47.6-7.4 69.4-13.9L448 480h112l-67.4-113.7c54.5-35.4 88.4-84.9 88.4-139.7zm-466.8 14.5c0-73.5 98.9-133 220.8-133s211.9 40.7 211.9 133c0 50.1-26.5 85-70.3 106.4-2.4-1.6-4.7-2.9-6.4-3.7-10.2-5.2-27.8-10.5-27.8-10.5s86.6-6.4 86.6-92.7-90.6-87.9-90.6-87.9h-199V361c-74.1-21.5-125.2-67.1-125.2-119.9zm225.1 38.3v-55.6c57.8 0 87.8-6.8 87.8 27.3 0 36.5-38.2 28.3-87.8 28.3zm-.9 72.5H365c10.8 0 18.9 11.7 24 19.2-16.1 1.9-33 2.8-50.6 2.9v-22.1z"/></svg> Studio - Either: - New file - New project - Shiny Web Application - Launch application - `|> Run App` - `Cmd/Ctrl + Shift + Enter` ] --- # Minimal Shiny App: app view ***Options to view your application:*** 1. Pop-out window (default) 2. Viewer pane 3. External (*i.e.* your web browser) --- # Minimal Shiny App: workflow ***Typical Shiny development workflow:*** 1. Write code. 2. Launch the app 3. Play with the app 4. Close the app Repeat -- <svg aria-hidden="true" role="img" viewBox="0 0 192 512" style="height:1em;width:0.38em;vertical-align:-0.125em;margin-left:auto;margin-right:auto;font-size:inherit;fill:currentColor;overflow:visible;position:relative;"><path d="M144 80c0 26.5-21.5 48-48 48s-48-21.5-48-48s21.5-48 48-48s48 21.5 48 48zM0 224c0-17.7 14.3-32 32-32H96c17.7 0 32 14.3 32 32V448h32c17.7 0 32 14.3 32 32s-14.3 32-32 32H32c-17.7 0-32-14.3-32-32s14.3-32 32-32H64V256H32c-17.7 0-32-14.3-32-32z"/></svg> you can also trigger autoreload, see [here](https://github.com/sol-eng/background-jobs/tree/master/shiny-job) <svg aria-hidden="true" role="img" viewBox="0 0 512 512" style="height:1em;width:1em;vertical-align:-0.125em;margin-left:auto;margin-right:auto;font-size:inherit;fill:currentColor;overflow:visible;position:relative;"><path d="M256 32c14.2 0 27.3 7.5 34.5 19.8l216 368c7.3 12.4 7.3 27.7 .2 40.1S486.3 480 472 480H40c-14.3 0-27.6-7.7-34.7-20.1s-7-27.8 .2-40.1l216-368C228.7 39.5 241.8 32 256 32zm0 128c-13.3 0-24 10.7-24 24V296c0 13.3 10.7 24 24 24s24-10.7 24-24V184c0-13.3-10.7-24-24-24zm32 224c0-17.7-14.3-32-32-32s-32 14.3-32 32s14.3 32 32 32s32-14.3 32-32z"/></svg> but be aware that this makes debugging the app much harder --- # Minimal Shiny App: create a project ### <svg aria-hidden="true" role="img" viewBox="0 0 640 512" style="height:1em;width:1.25em;vertical-align:-0.125em;margin-left:auto;margin-right:auto;font-size:inherit;fill:currentColor;overflow:visible;position:relative;"><path d="M64 96c0-35.3 28.7-64 64-64H512c35.3 0 64 28.7 64 64V352H512V96H128V352H64V96zM0 403.2C0 392.6 8.6 384 19.2 384H620.8c10.6 0 19.2 8.6 19.2 19.2c0 42.4-34.4 76.8-76.8 76.8H76.8C34.4 480 0 445.6 0 403.2zM281 209l-31 31 31 31c9.4 9.4 9.4 24.6 0 33.9s-24.6 9.4-33.9 0l-48-48c-9.4-9.4-9.4-24.6 0-33.9l48-48c9.4-9.4 24.6-9.4 33.9 0s9.4 24.6 0 33.9zM393 175l48 48c9.4 9.4 9.4 24.6 0 33.9l-48 48c-9.4 9.4-24.6 9.4-33.9 0s-9.4-24.6 0-33.9l31-31-31-31c-9.4-9.4-9.4-24.6 0-33.9s24.6-9.4 33.9 0z"/></svg> Create Shiny project and launch the default Shiny app provided by <svg aria-hidden="true" role="img" viewBox="0 0 581 512" style="height:1em;width:1.13em;vertical-align:-0.125em;margin-left:auto;margin-right:auto;font-size:inherit;fill:currentColor;overflow:visible;position:relative;"><path d="M581 226.6C581 119.1 450.9 32 290.5 32S0 119.1 0 226.6C0 322.4 103.3 402 239.4 418.1V480h99.1v-61.5c24.3-2.7 47.6-7.4 69.4-13.9L448 480h112l-67.4-113.7c54.5-35.4 88.4-84.9 88.4-139.7zm-466.8 14.5c0-73.5 98.9-133 220.8-133s211.9 40.7 211.9 133c0 50.1-26.5 85-70.3 106.4-2.4-1.6-4.7-2.9-6.4-3.7-10.2-5.2-27.8-10.5-27.8-10.5s86.6-6.4 86.6-92.7-90.6-87.9-90.6-87.9h-199V361c-74.1-21.5-125.2-67.1-125.2-119.9zm225.1 38.3v-55.6c57.8 0 87.8-6.8 87.8 27.3 0 36.5-38.2 28.3-87.8 28.3zm-.9 72.5H365c10.8 0 18.9 11.7 24 19.2-16.1 1.9-33 2.8-50.6 2.9v-22.1z"/></svg> Studio <div class="countdown" id="timer_b6741344" data-update-every="1" tabindex="0" style="right:0;bottom:0;margin:1em;"> <div class="countdown-controls"><button class="countdown-bump-down">−</button><button class="countdown-bump-up">+</button></div> <code class="countdown-time"><span class="countdown-digits minutes">15</span><span class="countdown-digits colon">:</span><span class="countdown-digits seconds">00</span></code> </div> --- # Minimal Shiny App: reactive graph ### [`reactlog`](https://rstudio.github.io/reactlog/) draws the reactive graph for you! > Behind the scenes, Shiny builds a reactive graph that can quickly become intertwined and difficult to debug. reactlog provides a visual insight into that black box of Shiny reactivity. -- ***How to use `reactlog`*** -- - Run `reactlog::reactlog_enable()` before launching your app -- - Type `Cmd + F3` (<svg aria-hidden="true" role="img" viewBox="0 0 384 512" style="height:1em;width:0.75em;vertical-align:-0.125em;margin-left:auto;margin-right:auto;font-size:inherit;fill:currentColor;overflow:visible;position:relative;"><path d="M318.7 268.7c-.2-36.7 16.4-64.4 50-84.8-18.8-26.9-47.2-41.7-84.7-44.6-35.5-2.8-74.3 20.7-88.5 20.7-15 0-49.4-19.7-76.4-19.7C63.3 141.2 4 184.8 4 273.5q0 39.3 14.4 81.2c12.8 36.7 59 126.7 107.2 125.2 25.2-.6 43-17.9 75.8-17.9 31.8 0 48.3 17.9 76.4 17.9 48.6-.7 90.4-82.5 102.6-119.3-65.2-30.7-61.7-90-61.7-91.9zm-56.6-164.2c27.3-32.4 24.8-61.9 24-72.5-24.1 1.4-52 16.4-67.9 34.9-17.5 19.8-27.8 44.3-25.6 71.9 26.1 2 49.9-11.4 69.5-34.3z"/></svg>) or `Ctrl + F3` (<svg aria-hidden="true" role="img" viewBox="0 0 448 512" style="height:1em;width:0.88em;vertical-align:-0.125em;margin-left:auto;margin-right:auto;font-size:inherit;fill:currentColor;overflow:visible;position:relative;"><path d="M0 93.7l183.6-25.3v177.4H0V93.7zm0 324.6l183.6 25.3V268.4H0v149.9zm203.8 28L448 480V268.4H203.8v177.9zm0-380.6v180.1H448V32L203.8 65.7z"/></svg> <svg aria-hidden="true" role="img" viewBox="0 0 448 512" style="height:1em;width:0.88em;vertical-align:-0.125em;margin-left:auto;margin-right:auto;font-size:inherit;fill:currentColor;overflow:visible;position:relative;"><path d="M220.8 123.3c1 .5 1.8 1.7 3 1.7 1.1 0 2.8-.4 2.9-1.5.2-1.4-1.9-2.3-3.2-2.9-1.7-.7-3.9-1-5.5-.1-.4.2-.8.7-.6 1.1.3 1.3 2.3 1.1 3.4 1.7zm-21.9 1.7c1.2 0 2-1.2 3-1.7 1.1-.6 3.1-.4 3.5-1.6.2-.4-.2-.9-.6-1.1-1.6-.9-3.8-.6-5.5.1-1.3.6-3.4 1.5-3.2 2.9.1 1 1.8 1.5 2.8 1.4zM420 403.8c-3.6-4-5.3-11.6-7.2-19.7-1.8-8.1-3.9-16.8-10.5-22.4-1.3-1.1-2.6-2.1-4-2.9-1.3-.8-2.7-1.5-4.1-2 9.2-27.3 5.6-54.5-3.7-79.1-11.4-30.1-31.3-56.4-46.5-74.4-17.1-21.5-33.7-41.9-33.4-72C311.1 85.4 315.7.1 234.8 0 132.4-.2 158 103.4 156.9 135.2c-1.7 23.4-6.4 41.8-22.5 64.7-18.9 22.5-45.5 58.8-58.1 96.7-6 17.9-8.8 36.1-6.2 53.3-6.5 5.8-11.4 14.7-16.6 20.2-4.2 4.3-10.3 5.9-17 8.3s-14 6-18.5 14.5c-2.1 3.9-2.8 8.1-2.8 12.4 0 3.9.6 7.9 1.2 11.8 1.2 8.1 2.5 15.7.8 20.8-5.2 14.4-5.9 24.4-2.2 31.7 3.8 7.3 11.4 10.5 20.1 12.3 17.3 3.6 40.8 2.7 59.3 12.5 19.8 10.4 39.9 14.1 55.9 10.4 11.6-2.6 21.1-9.6 25.9-20.2 12.5-.1 26.3-5.4 48.3-6.6 14.9-1.2 33.6 5.3 55.1 4.1.6 2.3 1.4 4.6 2.5 6.7v.1c8.3 16.7 23.8 24.3 40.3 23 16.6-1.3 34.1-11 48.3-27.9 13.6-16.4 36-23.2 50.9-32.2 7.4-4.5 13.4-10.1 13.9-18.3.4-8.2-4.4-17.3-15.5-29.7zM223.7 87.3c9.8-22.2 34.2-21.8 44-.4 6.5 14.2 3.6 30.9-4.3 40.4-1.6-.8-5.9-2.6-12.6-4.9 1.1-1.2 3.1-2.7 3.9-4.6 4.8-11.8-.2-27-9.1-27.3-7.3-.5-13.9 10.8-11.8 23-4.1-2-9.4-3.5-13-4.4-1-6.9-.3-14.6 2.9-21.8zM183 75.8c10.1 0 20.8 14.2 19.1 33.5-3.5 1-7.1 2.5-10.2 4.6 1.2-8.9-3.3-20.1-9.6-19.6-8.4.7-9.8 21.2-1.8 28.1 1 .8 1.9-.2-5.9 5.5-15.6-14.6-10.5-52.1 8.4-52.1zm-13.6 60.7c6.2-4.6 13.6-10 14.1-10.5 4.7-4.4 13.5-14.2 27.9-14.2 7.1 0 15.6 2.3 25.9 8.9 6.3 4.1 11.3 4.4 22.6 9.3 8.4 3.5 13.7 9.7 10.5 18.2-2.6 7.1-11 14.4-22.7 18.1-11.1 3.6-19.8 16-38.2 14.9-3.9-.2-7-1-9.6-2.1-8-3.5-12.2-10.4-20-15-8.6-4.8-13.2-10.4-14.7-15.3-1.4-4.9 0-9 4.2-12.3zm3.3 334c-2.7 35.1-43.9 34.4-75.3 18-29.9-15.8-68.6-6.5-76.5-21.9-2.4-4.7-2.4-12.7 2.6-26.4v-.2c2.4-7.6.6-16-.6-23.9-1.2-7.8-1.8-15 .9-20 3.5-6.7 8.5-9.1 14.8-11.3 10.3-3.7 11.8-3.4 19.6-9.9 5.5-5.7 9.5-12.9 14.3-18 5.1-5.5 10-8.1 17.7-6.9 8.1 1.2 15.1 6.8 21.9 16l19.6 35.6c9.5 19.9 43.1 48.4 41 68.9zm-1.4-25.9c-4.1-6.6-9.6-13.6-14.4-19.6 7.1 0 14.2-2.2 16.7-8.9 2.3-6.2 0-14.9-7.4-24.9-13.5-18.2-38.3-32.5-38.3-32.5-13.5-8.4-21.1-18.7-24.6-29.9s-3-23.3-.3-35.2c5.2-22.9 18.6-45.2 27.2-59.2 2.3-1.7.8 3.2-8.7 20.8-8.5 16.1-24.4 53.3-2.6 82.4.6-20.7 5.5-41.8 13.8-61.5 12-27.4 37.3-74.9 39.3-112.7 1.1.8 4.6 3.2 6.2 4.1 4.6 2.7 8.1 6.7 12.6 10.3 12.4 10 28.5 9.2 42.4 1.2 6.2-3.5 11.2-7.5 15.9-9 9.9-3.1 17.8-8.6 22.3-15 7.7 30.4 25.7 74.3 37.2 95.7 6.1 11.4 18.3 35.5 23.6 64.6 3.3-.1 7 .4 10.9 1.4 13.8-35.7-11.7-74.2-23.3-84.9-4.7-4.6-4.9-6.6-2.6-6.5 12.6 11.2 29.2 33.7 35.2 59 2.8 11.6 3.3 23.7.4 35.7 16.4 6.8 35.9 17.9 30.7 34.8-2.2-.1-3.2 0-4.2 0 3.2-10.1-3.9-17.6-22.8-26.1-19.6-8.6-36-8.6-38.3 12.5-12.1 4.2-18.3 14.7-21.4 27.3-2.8 11.2-3.6 24.7-4.4 39.9-.5 7.7-3.6 18-6.8 29-32.1 22.9-76.7 32.9-114.3 7.2zm257.4-11.5c-.9 16.8-41.2 19.9-63.2 46.5-13.2 15.7-29.4 24.4-43.6 25.5s-26.5-4.8-33.7-19.3c-4.7-11.1-2.4-23.1 1.1-36.3 3.7-14.2 9.2-28.8 9.9-40.6.8-15.2 1.7-28.5 4.2-38.7 2.6-10.3 6.6-17.2 13.7-21.1.3-.2.7-.3 1-.5.8 13.2 7.3 26.6 18.8 29.5 12.6 3.3 30.7-7.5 38.4-16.3 9-.3 15.7-.9 22.6 5.1 9.9 8.5 7.1 30.3 17.1 41.6 10.6 11.6 14 19.5 13.7 24.6zM173.3 148.7c2 1.9 4.7 4.5 8 7.1 6.6 5.2 15.8 10.6 27.3 10.6 11.6 0 22.5-5.9 31.8-10.8 4.9-2.6 10.9-7 14.8-10.4s5.9-6.3 3.1-6.6-2.6 2.6-6 5.1c-4.4 3.2-9.7 7.4-13.9 9.8-7.4 4.2-19.5 10.2-29.9 10.2s-18.7-4.8-24.9-9.7c-3.1-2.5-5.7-5-7.7-6.9-1.5-1.4-1.9-4.6-4.3-4.9-1.4-.1-1.8 3.7 1.7 6.5z"/></svg>) while app is running -- - Alternatively, run `shiny::reactlogShow()` once you close the app -- ### <svg aria-hidden="true" role="img" viewBox="0 0 640 512" style="height:1em;width:1.25em;vertical-align:-0.125em;margin-left:auto;margin-right:auto;font-size:inherit;fill:currentColor;overflow:visible;position:relative;"><path d="M64 96c0-35.3 28.7-64 64-64H512c35.3 0 64 28.7 64 64V352H512V96H128V352H64V96zM0 403.2C0 392.6 8.6 384 19.2 384H620.8c10.6 0 19.2 8.6 19.2 19.2c0 42.4-34.4 76.8-76.8 76.8H76.8C34.4 480 0 445.6 0 403.2zM281 209l-31 31 31 31c9.4 9.4 9.4 24.6 0 33.9s-24.6 9.4-33.9 0l-48-48c-9.4-9.4-9.4-24.6 0-33.9l48-48c9.4-9.4 24.6-9.4 33.9 0s9.4 24.6 0 33.9zM393 175l48 48c9.4 9.4 9.4 24.6 0 33.9l-48 48c-9.4 9.4-24.6 9.4-33.9 0s-9.4-24.6 0-33.9l31-31-31-31c-9.4-9.4-9.4-24.6 0-33.9s24.6-9.4 33.9 0z"/></svg> Use `reactlog` with the default Shiny app <div class="countdown" id="timer_88dcf6b2" data-update-every="1" tabindex="0" style="right:0;bottom:0;margin:1em;"> <div class="countdown-controls"><button class="countdown-bump-down">−</button><button class="countdown-bump-up">+</button></div> <code class="countdown-time"><span class="countdown-digits minutes">10</span><span class="countdown-digits colon">:</span><span class="countdown-digits seconds">00</span></code> </div> --- # Minimal Shiny App: debugging ***Troubleshooting in Shiny is not intuitive at first*** ***Common problems:*** - Unexpected error (*easiest*) - No error, yet incorrect value (*medium*) - Values correct, but unexpected update (*hardest*) --- # Minimal Shiny App: debugging ### Error traceback ```r f <- function(x) g(x) g <- function(x) h(x) h <- function(x) x * 2 f("a") #> Error in x * 2: non-numeric argument to binary operator ``` -- ```r traceback() #> 3: h(x) #> 2: g(x) #> 1: f("a") ``` .font90[<svg aria-hidden="true" role="img" viewBox="0 0 192 512" style="height:1em;width:0.38em;vertical-align:-0.125em;margin-left:auto;margin-right:auto;font-size:inherit;fill:currentColor;overflow:visible;position:relative;"><path d="M144 80c0 26.5-21.5 48-48 48s-48-21.5-48-48s21.5-48 48-48s48 21.5 48 48zM0 224c0-17.7 14.3-32 32-32H96c17.7 0 32 14.3 32 32V448h32c17.7 0 32 14.3 32 32s-14.3 32-32 32H32c-17.7 0-32-14.3-32-32s14.3-32 32-32H64V256H32c-17.7 0-32-14.3-32-32z"/></svg> example from [Mastering Shiny book](https://mastering-shiny.org/action-workflow.html#reading-tracebacks)] --- # Minimal Shiny App: debugging ### Error traceback in Shiny - By default, Shiny provides a traceback in the console ``` Error in *: non-numeric argument to binary operator 169: g [app.R#4] 168: f [app.R#3] 167: renderPlot [app.R#13] 165: func 125: drawPlot 111: <reactive:plotObj> 95: drawReactive 82: renderFunc 81: output$plot 1: runApp ``` .font90[<svg aria-hidden="true" role="img" viewBox="0 0 192 512" style="height:1em;width:0.38em;vertical-align:-0.125em;margin-left:auto;margin-right:auto;font-size:inherit;fill:currentColor;overflow:visible;position:relative;"><path d="M144 80c0 26.5-21.5 48-48 48s-48-21.5-48-48s21.5-48 48-48s48 21.5 48 48zM0 224c0-17.7 14.3-32 32-32H96c17.7 0 32 14.3 32 32V448h32c17.7 0 32 14.3 32 32s-14.3 32-32 32H32c-17.7 0-32-14.3-32-32s14.3-32 32-32H64V256H32c-17.7 0-32-14.3-32-32z"/></svg> example from [Mastering Shiny book](https://mastering-shiny.org/action-workflow.html#reading-tracebacks)] ??? show live by change `input$bins + 1` to `input$bins + "a"` in server --- # Minimal Shiny App: debugging ### Interactive debugger .pull-left[ ***`browser()`*** .font90[ ```r server <- function(input, output, session) { selected <- reactive({ browser() subset(sales, TERRITORY %in% input$territory) }) } ``` ] .font90[<svg aria-hidden="true" role="img" viewBox="0 0 512 512" style="height:1em;width:1em;vertical-align:-0.125em;margin-left:auto;margin-right:auto;font-size:inherit;fill:currentColor;overflow:visible;position:relative;"><path d="M256 32c14.2 0 27.3 7.5 34.5 19.8l216 368c7.3 12.4 7.3 27.7 .2 40.1S486.3 480 472 480H40c-14.3 0-27.6-7.7-34.7-20.1s-7-27.8 .2-40.1l216-368C228.7 39.5 241.8 32 256 32zm0 128c-13.3 0-24 10.7-24 24V296c0 13.3 10.7 24 24 24s24-10.7 24-24V184c0-13.3-10.7-24-24-24zm32 224c0-17.7-14.3-32-32-32s-32 14.3-32 32s14.3 32 32 32s32-14.3 32-32z"/></svg> Do not forget to remove once finished debugging] ] .pull-right[ ***<svg aria-hidden="true" role="img" viewBox="0 0 581 512" style="height:1em;width:1.13em;vertical-align:-0.125em;margin-left:auto;margin-right:auto;font-size:inherit;fill:currentColor;overflow:visible;position:relative;"><path d="M581 226.6C581 119.1 450.9 32 290.5 32S0 119.1 0 226.6C0 322.4 103.3 402 239.4 418.1V480h99.1v-61.5c24.3-2.7 47.6-7.4 69.4-13.9L448 480h112l-67.4-113.7c54.5-35.4 88.4-84.9 88.4-139.7zm-466.8 14.5c0-73.5 98.9-133 220.8-133s211.9 40.7 211.9 133c0 50.1-26.5 85-70.3 106.4-2.4-1.6-4.7-2.9-6.4-3.7-10.2-5.2-27.8-10.5-27.8-10.5s86.6-6.4 86.6-92.7-90.6-87.9-90.6-87.9h-199V361c-74.1-21.5-125.2-67.1-125.2-119.9zm225.1 38.3v-55.6c57.8 0 87.8-6.8 87.8 27.3 0 36.5-38.2 28.3-87.8 28.3zm-.9 72.5H365c10.8 0 18.9 11.7 24 19.2-16.1 1.9-33 2.8-50.6 2.9v-22.1z"/></svg> Studio breakpoint*** 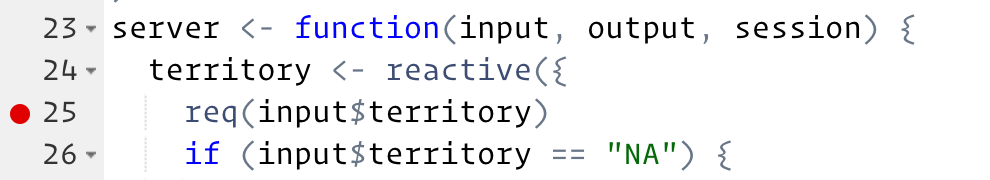 .font90[<svg aria-hidden="true" role="img" viewBox="0 0 512 512" style="height:1em;width:1em;vertical-align:-0.125em;margin-left:auto;margin-right:auto;font-size:inherit;fill:currentColor;overflow:visible;position:relative;"><path d="M256 32c14.2 0 27.3 7.5 34.5 19.8l216 368c7.3 12.4 7.3 27.7 .2 40.1S486.3 480 472 480H40c-14.3 0-27.6-7.7-34.7-20.1s-7-27.8 .2-40.1l216-368C228.7 39.5 241.8 32 256 32zm0 128c-13.3 0-24 10.7-24 24V296c0 13.3 10.7 24 24 24s24-10.7 24-24V184c0-13.3-10.7-24-24-24zm32 224c0-17.7-14.3-32-32-32s-32 14.3-32 32s14.3 32 32 32s32-14.3 32-32z"/></svg> Can only be run in the server function] ] --- # Minimal Shiny App: debugging ### Tracing ***Showcase Mode*** `shiny::runApp(display.mode="showcase")` <img src="https://shiny.rstudio.com/images/debugging/kmeans-showcase.gif" alt="" width="75%"> --- # Minimal Shiny App: debugging ### Tracing ***"Print" debugging***: print messages in the console while app is running ```r # generate bins based on input$bins from ui.R x <- faithful[, 2] bins <- seq(min(x), max(x), length.out = input$bins + 1) message(glue::glue("updating histogram with {length(bins)} bins")) ``` --- class: inverse, center, middle # <svg aria-hidden="true" role="img" viewBox="0 0 192 512" style="height:1em;width:0.38em;vertical-align:-0.125em;margin-left:auto;margin-right:auto;font-size:inherit;fill:currentColor;overflow:visible;position:relative;"><path d="M144 80c0 26.5-21.5 48-48 48s-48-21.5-48-48s21.5-48 48-48s48 21.5 48 48zM0 224c0-17.7 14.3-32 32-32H96c17.7 0 32 14.3 32 32V448h32c17.7 0 32 14.3 32 32s-14.3 32-32 32H32c-17.7 0-32-14.3-32-32s14.3-32 32-32H64V256H32c-17.7 0-32-14.3-32-32z"/></svg> Exercise 1 ![:custom_hr]() --- # Minimal Shiny App: And so it begins... ***Context*** > Some partner are in charge of determining key biodiversity area of sea birds in eastern canada and we would like us to help them by providing a tool that gather data and explore those areas. --- # Minimal Shiny App: And so it begins... ***Objective***: > Build a Shiny app that will allow you to filter a data table and visualize the filtered table -- ***Data*** <svg aria-hidden="true" role="img" viewBox="0 0 448 512" style="height:1em;width:0.88em;vertical-align:-0.125em;margin-left:auto;margin-right:auto;font-size:inherit;fill:currentColor;overflow:visible;position:relative;"><path d="M448 80v48c0 44.2-100.3 80-224 80S0 172.2 0 128V80C0 35.8 100.3 0 224 0S448 35.8 448 80zM393.2 214.7c20.8-7.4 39.9-16.9 54.8-28.6V288c0 44.2-100.3 80-224 80S0 332.2 0 288V186.1c14.9 11.8 34 21.2 54.8 28.6C99.7 230.7 159.5 240 224 240s124.3-9.3 169.2-25.3zM0 346.1c14.9 11.8 34 21.2 54.8 28.6C99.7 390.7 159.5 400 224 400s124.3-9.3 169.2-25.3c20.8-7.4 39.9-16.9 54.8-28.6V432c0 44.2-100.3 80-224 80S0 476.2 0 432V346.1z"/></svg> - Atlas of Seabirds at Sea in Eastern Canada 2006-2016 [<svg aria-hidden="true" role="img" viewBox="0 0 448 512" style="height:1em;width:0.88em;vertical-align:-0.125em;margin-left:auto;margin-right:auto;font-size:inherit;fill:currentColor;overflow:visible;position:relative;"><path d="M448 80v48c0 44.2-100.3 80-224 80S0 172.2 0 128V80C0 35.8 100.3 0 224 0S448 35.8 448 80zM393.2 214.7c20.8-7.4 39.9-16.9 54.8-28.6V288c0 44.2-100.3 80-224 80S0 332.2 0 288V186.1c14.9 11.8 34 21.2 54.8 28.6C99.7 230.7 159.5 240 224 240s124.3-9.3 169.2-25.3zM0 346.1c14.9 11.8 34 21.2 54.8 28.6C99.7 390.7 159.5 400 224 400s124.3-9.3 169.2-25.3c20.8-7.4 39.9-16.9 54.8-28.6V432c0 44.2-100.3 80-224 80S0 476.2 0 432V346.1z"/></svg>](https://open.canada.ca/data/en/dataset/f612e2b4-5c67-46dc-9a84-1154c649ab4e) .pull-left[ ```r library(shiny) source("setup.R") densities <- read.csv("data/densities.csv") ``` ] .pull-right[ ```r densities <- read.csv("data/densities.csv") head(densities) ``` ] --- # Minimal Shiny App: building the app ***Data*** <svg aria-hidden="true" role="img" viewBox="0 0 448 512" style="height:1em;width:0.88em;vertical-align:-0.125em;margin-left:auto;margin-right:auto;font-size:inherit;fill:currentColor;overflow:visible;position:relative;"><path d="M448 80v48c0 44.2-100.3 80-224 80S0 172.2 0 128V80C0 35.8 100.3 0 224 0S448 35.8 448 80zM393.2 214.7c20.8-7.4 39.9-16.9 54.8-28.6V288c0 44.2-100.3 80-224 80S0 332.2 0 288V186.1c14.9 11.8 34 21.2 54.8 28.6C99.7 230.7 159.5 240 224 240s124.3-9.3 169.2-25.3zM0 346.1c14.9 11.8 34 21.2 54.8 28.6C99.7 390.7 159.5 400 224 400s124.3-9.3 169.2-25.3c20.8-7.4 39.9-16.9 54.8-28.6V432c0 44.2-100.3 80-224 80S0 476.2 0 432V346.1z"/></svg> - bird density -- ***layout*** (ui) <svg aria-hidden="true" role="img" viewBox="0 0 576 512" style="height:1em;width:1.12em;vertical-align:-0.125em;margin-left:auto;margin-right:auto;font-size:inherit;fill:currentColor;overflow:visible;position:relative;"><path d="M160 256C160 185.3 217.3 128 288 128C358.7 128 416 185.3 416 256C416 326.7 358.7 384 288 384C217.3 384 160 326.7 160 256zM288 336C332.2 336 368 300.2 368 256C368 211.8 332.2 176 288 176C287.3 176 286.7 176 285.1 176C287.3 181.1 288 186.5 288 192C288 227.3 259.3 256 224 256C218.5 256 213.1 255.3 208 253.1C208 254.7 208 255.3 208 255.1C208 300.2 243.8 336 288 336L288 336zM95.42 112.6C142.5 68.84 207.2 32 288 32C368.8 32 433.5 68.84 480.6 112.6C527.4 156 558.7 207.1 573.5 243.7C576.8 251.6 576.8 260.4 573.5 268.3C558.7 304 527.4 355.1 480.6 399.4C433.5 443.2 368.8 480 288 480C207.2 480 142.5 443.2 95.42 399.4C48.62 355.1 17.34 304 2.461 268.3C-.8205 260.4-.8205 251.6 2.461 243.7C17.34 207.1 48.62 156 95.42 112.6V112.6zM288 80C222.8 80 169.2 109.6 128.1 147.7C89.6 183.5 63.02 225.1 49.44 256C63.02 286 89.6 328.5 128.1 364.3C169.2 402.4 222.8 432 288 432C353.2 432 406.8 402.4 447.9 364.3C486.4 328.5 512.1 286 526.6 256C512.1 225.1 486.4 183.5 447.9 147.7C406.8 109.6 353.2 80 288 80V80z"/></svg> - side panel: user inputs - main panel: server outputs -- ***user inputs*** (ui) <svg aria-hidden="true" role="img" viewBox="0 0 576 512" style="height:1em;width:1.12em;vertical-align:-0.125em;margin-left:auto;margin-right:auto;font-size:inherit;fill:currentColor;overflow:visible;position:relative;"><path d="M160 256C160 185.3 217.3 128 288 128C358.7 128 416 185.3 416 256C416 326.7 358.7 384 288 384C217.3 384 160 326.7 160 256zM288 336C332.2 336 368 300.2 368 256C368 211.8 332.2 176 288 176C287.3 176 286.7 176 285.1 176C287.3 181.1 288 186.5 288 192C288 227.3 259.3 256 224 256C218.5 256 213.1 255.3 208 253.1C208 254.7 208 255.3 208 255.1C208 300.2 243.8 336 288 336L288 336zM95.42 112.6C142.5 68.84 207.2 32 288 32C368.8 32 433.5 68.84 480.6 112.6C527.4 156 558.7 207.1 573.5 243.7C576.8 251.6 576.8 260.4 573.5 268.3C558.7 304 527.4 355.1 480.6 399.4C433.5 443.2 368.8 480 288 480C207.2 480 142.5 443.2 95.42 399.4C48.62 355.1 17.34 304 2.461 268.3C-.8205 260.4-.8205 251.6 2.461 243.7C17.34 207.1 48.62 156 95.42 112.6V112.6zM288 80C222.8 80 169.2 109.6 128.1 147.7C89.6 183.5 63.02 225.1 49.44 256C63.02 286 89.6 328.5 128.1 364.3C169.2 402.4 222.8 432 288 432C353.2 432 406.8 402.4 447.9 364.3C486.4 328.5 512.1 286 526.6 256C512.1 225.1 486.4 183.5 447.9 147.7C406.8 109.6 353.2 80 288 80V80z"/></svg> - select input: `species` - select input: `periods` -- ***server output*** <svg aria-hidden="true" role="img" viewBox="0 0 640 512" style="height:1em;width:1.25em;vertical-align:-0.125em;margin-left:auto;margin-right:auto;font-size:inherit;fill:currentColor;overflow:visible;position:relative;"><path d="M308.5 135.3c7.1-6.3 9.9-16.2 6.2-25c-2.3-5.3-4.8-10.5-7.6-15.5L304 89.4c-3-5-6.3-9.9-9.8-14.6c-5.7-7.6-15.7-10.1-24.7-7.1l-28.2 9.3c-10.7-8.8-23-16-36.2-20.9L199 27.1c-1.9-9.3-9.1-16.7-18.5-17.8C173.7 8.4 166.9 8 160 8s-13.7 .4-20.4 1.2c-9.4 1.1-16.6 8.6-18.5 17.8L115 56.1c-13.3 5-25.5 12.1-36.2 20.9L50.5 67.8c-9-3-19-.5-24.7 7.1c-3.5 4.7-6.8 9.6-9.9 14.6l-3 5.3c-2.8 5-5.3 10.2-7.6 15.6c-3.7 8.7-.9 18.6 6.2 25l22.2 19.8C32.6 161.9 32 168.9 32 176s.6 14.1 1.7 20.9L11.5 216.7c-7.1 6.3-9.9 16.2-6.2 25c2.3 5.3 4.8 10.5 7.6 15.6l3 5.2c3 5.1 6.3 9.9 9.9 14.6c5.7 7.6 15.7 10.1 24.7 7.1l28.2-9.3c10.7 8.8 23 16 36.2 20.9l6.1 29.1c1.9 9.3 9.1 16.7 18.5 17.8c6.7 .8 13.5 1.2 20.4 1.2s13.7-.4 20.4-1.2c9.4-1.1 16.6-8.6 18.5-17.8l6.1-29.1c13.3-5 25.5-12.1 36.2-20.9l28.2 9.3c9 3 19 .5 24.7-7.1c3.5-4.7 6.8-9.5 9.8-14.6l3.1-5.4c2.8-5 5.3-10.2 7.6-15.5c3.7-8.7 .9-18.6-6.2-25l-22.2-19.8c1.1-6.8 1.7-13.8 1.7-20.9s-.6-14.1-1.7-20.9l22.2-19.8zM208 176c0 26.5-21.5 48-48 48s-48-21.5-48-48s21.5-48 48-48s48 21.5 48 48zM504.7 500.5c6.3 7.1 16.2 9.9 25 6.2c5.3-2.3 10.5-4.8 15.5-7.6l5.4-3.1c5-3 9.9-6.3 14.6-9.8c7.6-5.7 10.1-15.7 7.1-24.7l-9.3-28.2c8.8-10.7 16-23 20.9-36.2l29.1-6.1c9.3-1.9 16.7-9.1 17.8-18.5c.8-6.7 1.2-13.5 1.2-20.4s-.4-13.7-1.2-20.4c-1.1-9.4-8.6-16.6-17.8-18.5L583.9 307c-5-13.3-12.1-25.5-20.9-36.2l9.3-28.2c3-9 .5-19-7.1-24.7c-4.7-3.5-9.6-6.8-14.6-9.9l-5.3-3c-5-2.8-10.2-5.3-15.6-7.6c-8.7-3.7-18.6-.9-25 6.2l-19.8 22.2c-6.8-1.1-13.8-1.7-20.9-1.7s-14.1 .6-20.9 1.7l-19.8-22.2c-6.3-7.1-16.2-9.9-25-6.2c-5.3 2.3-10.5 4.8-15.6 7.6l-5.2 3c-5.1 3-9.9 6.3-14.6 9.9c-7.6 5.7-10.1 15.7-7.1 24.7l9.3 28.2c-8.8 10.7-16 23-20.9 36.2L315.1 313c-9.3 1.9-16.7 9.1-17.8 18.5c-.8 6.7-1.2 13.5-1.2 20.4s.4 13.7 1.2 20.4c1.1 9.4 8.6 16.6 17.8 18.5l29.1 6.1c5 13.3 12.1 25.5 20.9 36.2l-9.3 28.2c-3 9-.5 19 7.1 24.7c4.7 3.5 9.5 6.8 14.6 9.8l5.4 3.1c5 2.8 10.2 5.3 15.5 7.6c8.7 3.7 18.6 .9 25-6.2l19.8-22.2c6.8 1.1 13.8 1.7 20.9 1.7s14.1-.6 20.9-1.7l19.8 22.2zM464 400c-26.5 0-48-21.5-48-48s21.5-48 48-48s48 21.5 48 48s-21.5 48-48 48z"/></svg> - filter data based selected inputs - render filtered table --- # Minimal Shiny App: building the app .pull-left[ ***Data*** <svg aria-hidden="true" role="img" viewBox="0 0 448 512" style="height:1em;width:0.88em;vertical-align:-0.125em;margin-left:auto;margin-right:auto;font-size:inherit;fill:currentColor;overflow:visible;position:relative;"><path d="M448 80v48c0 44.2-100.3 80-224 80S0 172.2 0 128V80C0 35.8 100.3 0 224 0S448 35.8 448 80zM393.2 214.7c20.8-7.4 39.9-16.9 54.8-28.6V288c0 44.2-100.3 80-224 80S0 332.2 0 288V186.1c14.9 11.8 34 21.2 54.8 28.6C99.7 230.7 159.5 240 224 240s124.3-9.3 169.2-25.3zM0 346.1c14.9 11.8 34 21.2 54.8 28.6C99.7 390.7 159.5 400 224 400s124.3-9.3 169.2-25.3c20.8-7.4 39.9-16.9 54.8-28.6V432c0 44.2-100.3 80-224 80S0 476.2 0 432V346.1z"/></svg> - bird density ] .pull-right[ ***What to do*** - Download and format the data [<svg aria-hidden="true" role="img" viewBox="0 0 384 512" style="height:1em;width:0.75em;vertical-align:-0.125em;margin-left:auto;margin-right:auto;font-size:inherit;fill:currentColor;overflow:visible;position:relative;"><path d="M0 64C0 28.65 28.65 0 64 0H229.5C246.5 0 262.7 6.743 274.7 18.75L365.3 109.3C377.3 121.3 384 137.5 384 154.5V448C384 483.3 355.3 512 320 512H64C28.65 512 0 483.3 0 448V64zM336 448V160H256C238.3 160 224 145.7 224 128V48H64C55.16 48 48 55.16 48 64V448C48 456.8 55.16 464 64 464H320C328.8 464 336 456.8 336 448z"/></svg>](https://github.com/inSilecoInc/cws-shiny-template/blob/main/setup.R) - Import species density table as global variable ] <div class="countdown" id="timer_0ea1e89f" data-update-every="1" tabindex="0" style="right:0;bottom:0;margin:1em;"> <div class="countdown-controls"><button class="countdown-bump-down">−</button><button class="countdown-bump-up">+</button></div> <code class="countdown-time"><span class="countdown-digits minutes">10</span><span class="countdown-digits colon">:</span><span class="countdown-digits seconds">00</span></code> </div> --- # Minimal Shiny App: building the app .pull-left[ ***Data*** <svg aria-hidden="true" role="img" viewBox="0 0 448 512" style="height:1em;width:0.88em;vertical-align:-0.125em;margin-left:auto;margin-right:auto;font-size:inherit;fill:currentColor;overflow:visible;position:relative;"><path d="M448 80v48c0 44.2-100.3 80-224 80S0 172.2 0 128V80C0 35.8 100.3 0 224 0S448 35.8 448 80zM393.2 214.7c20.8-7.4 39.9-16.9 54.8-28.6V288c0 44.2-100.3 80-224 80S0 332.2 0 288V186.1c14.9 11.8 34 21.2 54.8 28.6C99.7 230.7 159.5 240 224 240s124.3-9.3 169.2-25.3zM0 346.1c14.9 11.8 34 21.2 54.8 28.6C99.7 390.7 159.5 400 224 400s124.3-9.3 169.2-25.3c20.8-7.4 39.9-16.9 54.8-28.6V432c0 44.2-100.3 80-224 80S0 476.2 0 432V346.1z"/></svg> - bird density <svg aria-hidden="true" role="img" viewBox="0 0 512 512" style="height:1em;width:1em;vertical-align:-0.125em;margin-left:auto;margin-right:auto;font-size:inherit;fill:currentColor;overflow:visible;position:relative;"><path d="M470.6 105.4c12.5 12.5 12.5 32.8 0 45.3l-256 256c-12.5 12.5-32.8 12.5-45.3 0l-128-128c-12.5-12.5-12.5-32.8 0-45.3s32.8-12.5 45.3 0L192 338.7 425.4 105.4c12.5-12.5 32.8-12.5 45.3 0z"/></svg> ***layout*** (ui) <svg aria-hidden="true" role="img" viewBox="0 0 576 512" style="height:1em;width:1.12em;vertical-align:-0.125em;margin-left:auto;margin-right:auto;font-size:inherit;fill:currentColor;overflow:visible;position:relative;"><path d="M160 256C160 185.3 217.3 128 288 128C358.7 128 416 185.3 416 256C416 326.7 358.7 384 288 384C217.3 384 160 326.7 160 256zM288 336C332.2 336 368 300.2 368 256C368 211.8 332.2 176 288 176C287.3 176 286.7 176 285.1 176C287.3 181.1 288 186.5 288 192C288 227.3 259.3 256 224 256C218.5 256 213.1 255.3 208 253.1C208 254.7 208 255.3 208 255.1C208 300.2 243.8 336 288 336L288 336zM95.42 112.6C142.5 68.84 207.2 32 288 32C368.8 32 433.5 68.84 480.6 112.6C527.4 156 558.7 207.1 573.5 243.7C576.8 251.6 576.8 260.4 573.5 268.3C558.7 304 527.4 355.1 480.6 399.4C433.5 443.2 368.8 480 288 480C207.2 480 142.5 443.2 95.42 399.4C48.62 355.1 17.34 304 2.461 268.3C-.8205 260.4-.8205 251.6 2.461 243.7C17.34 207.1 48.62 156 95.42 112.6V112.6zM288 80C222.8 80 169.2 109.6 128.1 147.7C89.6 183.5 63.02 225.1 49.44 256C63.02 286 89.6 328.5 128.1 364.3C169.2 402.4 222.8 432 288 432C353.2 432 406.8 402.4 447.9 364.3C486.4 328.5 512.1 286 526.6 256C512.1 225.1 486.4 183.5 447.9 147.7C406.8 109.6 353.2 80 288 80V80z"/></svg> - side panel: user inputs - main panel: server outputs ] .pull-right[ ***What to do*** ```r ?fluidpage ?sidebarLayout ?sidebarPanel ?mainPanel ``` .font80[<svg aria-hidden="true" role="img" viewBox="0 0 192 512" style="height:1em;width:0.38em;vertical-align:-0.125em;margin-left:auto;margin-right:auto;font-size:inherit;fill:currentColor;overflow:visible;position:relative;"><path d="M144 80c0 26.5-21.5 48-48 48s-48-21.5-48-48s21.5-48 48-48s48 21.5 48 48zM0 224c0-17.7 14.3-32 32-32H96c17.7 0 32 14.3 32 32V448h32c17.7 0 32 14.3 32 32s-14.3 32-32 32H32c-17.7 0-32-14.3-32-32s14.3-32 32-32H64V256H32c-17.7 0-32-14.3-32-32z"/></svg> Go [here](https://shiny.rstudio.com/articles/layout-guide.html) for an example of such a layout] ] <div class="countdown" id="timer_3b6ffd58" data-update-every="1" tabindex="0" style="right:0;bottom:0;margin:1em;"> <div class="countdown-controls"><button class="countdown-bump-down">−</button><button class="countdown-bump-up">+</button></div> <code class="countdown-time"><span class="countdown-digits minutes">10</span><span class="countdown-digits colon">:</span><span class="countdown-digits seconds">00</span></code> </div> --- # Minimal Shiny App: building the app .pull-left[ ***Data*** <svg aria-hidden="true" role="img" viewBox="0 0 448 512" style="height:1em;width:0.88em;vertical-align:-0.125em;margin-left:auto;margin-right:auto;font-size:inherit;fill:currentColor;overflow:visible;position:relative;"><path d="M448 80v48c0 44.2-100.3 80-224 80S0 172.2 0 128V80C0 35.8 100.3 0 224 0S448 35.8 448 80zM393.2 214.7c20.8-7.4 39.9-16.9 54.8-28.6V288c0 44.2-100.3 80-224 80S0 332.2 0 288V186.1c14.9 11.8 34 21.2 54.8 28.6C99.7 230.7 159.5 240 224 240s124.3-9.3 169.2-25.3zM0 346.1c14.9 11.8 34 21.2 54.8 28.6C99.7 390.7 159.5 400 224 400s124.3-9.3 169.2-25.3c20.8-7.4 39.9-16.9 54.8-28.6V432c0 44.2-100.3 80-224 80S0 476.2 0 432V346.1z"/></svg> - bird density <svg aria-hidden="true" role="img" viewBox="0 0 512 512" style="height:1em;width:1em;vertical-align:-0.125em;margin-left:auto;margin-right:auto;font-size:inherit;fill:currentColor;overflow:visible;position:relative;"><path d="M470.6 105.4c12.5 12.5 12.5 32.8 0 45.3l-256 256c-12.5 12.5-32.8 12.5-45.3 0l-128-128c-12.5-12.5-12.5-32.8 0-45.3s32.8-12.5 45.3 0L192 338.7 425.4 105.4c12.5-12.5 32.8-12.5 45.3 0z"/></svg> ***layout*** (ui) <svg aria-hidden="true" role="img" viewBox="0 0 576 512" style="height:1em;width:1.12em;vertical-align:-0.125em;margin-left:auto;margin-right:auto;font-size:inherit;fill:currentColor;overflow:visible;position:relative;"><path d="M160 256C160 185.3 217.3 128 288 128C358.7 128 416 185.3 416 256C416 326.7 358.7 384 288 384C217.3 384 160 326.7 160 256zM288 336C332.2 336 368 300.2 368 256C368 211.8 332.2 176 288 176C287.3 176 286.7 176 285.1 176C287.3 181.1 288 186.5 288 192C288 227.3 259.3 256 224 256C218.5 256 213.1 255.3 208 253.1C208 254.7 208 255.3 208 255.1C208 300.2 243.8 336 288 336L288 336zM95.42 112.6C142.5 68.84 207.2 32 288 32C368.8 32 433.5 68.84 480.6 112.6C527.4 156 558.7 207.1 573.5 243.7C576.8 251.6 576.8 260.4 573.5 268.3C558.7 304 527.4 355.1 480.6 399.4C433.5 443.2 368.8 480 288 480C207.2 480 142.5 443.2 95.42 399.4C48.62 355.1 17.34 304 2.461 268.3C-.8205 260.4-.8205 251.6 2.461 243.7C17.34 207.1 48.62 156 95.42 112.6V112.6zM288 80C222.8 80 169.2 109.6 128.1 147.7C89.6 183.5 63.02 225.1 49.44 256C63.02 286 89.6 328.5 128.1 364.3C169.2 402.4 222.8 432 288 432C353.2 432 406.8 402.4 447.9 364.3C486.4 328.5 512.1 286 526.6 256C512.1 225.1 486.4 183.5 447.9 147.7C406.8 109.6 353.2 80 288 80V80z"/></svg> - side panel: user inputs <svg aria-hidden="true" role="img" viewBox="0 0 512 512" style="height:1em;width:1em;vertical-align:-0.125em;margin-left:auto;margin-right:auto;font-size:inherit;fill:currentColor;overflow:visible;position:relative;"><path d="M470.6 105.4c12.5 12.5 12.5 32.8 0 45.3l-256 256c-12.5 12.5-32.8 12.5-45.3 0l-128-128c-12.5-12.5-12.5-32.8 0-45.3s32.8-12.5 45.3 0L192 338.7 425.4 105.4c12.5-12.5 32.8-12.5 45.3 0z"/></svg> - main panel: server outputs <svg aria-hidden="true" role="img" viewBox="0 0 512 512" style="height:1em;width:1em;vertical-align:-0.125em;margin-left:auto;margin-right:auto;font-size:inherit;fill:currentColor;overflow:visible;position:relative;"><path d="M470.6 105.4c12.5 12.5 12.5 32.8 0 45.3l-256 256c-12.5 12.5-32.8 12.5-45.3 0l-128-128c-12.5-12.5-12.5-32.8 0-45.3s32.8-12.5 45.3 0L192 338.7 425.4 105.4c12.5-12.5 32.8-12.5 45.3 0z"/></svg> ***user inputs*** (ui) <svg aria-hidden="true" role="img" viewBox="0 0 576 512" style="height:1em;width:1.12em;vertical-align:-0.125em;margin-left:auto;margin-right:auto;font-size:inherit;fill:currentColor;overflow:visible;position:relative;"><path d="M160 256C160 185.3 217.3 128 288 128C358.7 128 416 185.3 416 256C416 326.7 358.7 384 288 384C217.3 384 160 326.7 160 256zM288 336C332.2 336 368 300.2 368 256C368 211.8 332.2 176 288 176C287.3 176 286.7 176 285.1 176C287.3 181.1 288 186.5 288 192C288 227.3 259.3 256 224 256C218.5 256 213.1 255.3 208 253.1C208 254.7 208 255.3 208 255.1C208 300.2 243.8 336 288 336L288 336zM95.42 112.6C142.5 68.84 207.2 32 288 32C368.8 32 433.5 68.84 480.6 112.6C527.4 156 558.7 207.1 573.5 243.7C576.8 251.6 576.8 260.4 573.5 268.3C558.7 304 527.4 355.1 480.6 399.4C433.5 443.2 368.8 480 288 480C207.2 480 142.5 443.2 95.42 399.4C48.62 355.1 17.34 304 2.461 268.3C-.8205 260.4-.8205 251.6 2.461 243.7C17.34 207.1 48.62 156 95.42 112.6V112.6zM288 80C222.8 80 169.2 109.6 128.1 147.7C89.6 183.5 63.02 225.1 49.44 256C63.02 286 89.6 328.5 128.1 364.3C169.2 402.4 222.8 432 288 432C353.2 432 406.8 402.4 447.9 364.3C486.4 328.5 512.1 286 526.6 256C512.1 225.1 486.4 183.5 447.9 147.7C406.8 109.6 353.2 80 288 80V80z"/></svg> - select input: species - select input: periods ***server output*** <svg aria-hidden="true" role="img" viewBox="0 0 640 512" style="height:1em;width:1.25em;vertical-align:-0.125em;margin-left:auto;margin-right:auto;font-size:inherit;fill:currentColor;overflow:visible;position:relative;"><path d="M308.5 135.3c7.1-6.3 9.9-16.2 6.2-25c-2.3-5.3-4.8-10.5-7.6-15.5L304 89.4c-3-5-6.3-9.9-9.8-14.6c-5.7-7.6-15.7-10.1-24.7-7.1l-28.2 9.3c-10.7-8.8-23-16-36.2-20.9L199 27.1c-1.9-9.3-9.1-16.7-18.5-17.8C173.7 8.4 166.9 8 160 8s-13.7 .4-20.4 1.2c-9.4 1.1-16.6 8.6-18.5 17.8L115 56.1c-13.3 5-25.5 12.1-36.2 20.9L50.5 67.8c-9-3-19-.5-24.7 7.1c-3.5 4.7-6.8 9.6-9.9 14.6l-3 5.3c-2.8 5-5.3 10.2-7.6 15.6c-3.7 8.7-.9 18.6 6.2 25l22.2 19.8C32.6 161.9 32 168.9 32 176s.6 14.1 1.7 20.9L11.5 216.7c-7.1 6.3-9.9 16.2-6.2 25c2.3 5.3 4.8 10.5 7.6 15.6l3 5.2c3 5.1 6.3 9.9 9.9 14.6c5.7 7.6 15.7 10.1 24.7 7.1l28.2-9.3c10.7 8.8 23 16 36.2 20.9l6.1 29.1c1.9 9.3 9.1 16.7 18.5 17.8c6.7 .8 13.5 1.2 20.4 1.2s13.7-.4 20.4-1.2c9.4-1.1 16.6-8.6 18.5-17.8l6.1-29.1c13.3-5 25.5-12.1 36.2-20.9l28.2 9.3c9 3 19 .5 24.7-7.1c3.5-4.7 6.8-9.5 9.8-14.6l3.1-5.4c2.8-5 5.3-10.2 7.6-15.5c3.7-8.7 .9-18.6-6.2-25l-22.2-19.8c1.1-6.8 1.7-13.8 1.7-20.9s-.6-14.1-1.7-20.9l22.2-19.8zM208 176c0 26.5-21.5 48-48 48s-48-21.5-48-48s21.5-48 48-48s48 21.5 48 48zM504.7 500.5c6.3 7.1 16.2 9.9 25 6.2c5.3-2.3 10.5-4.8 15.5-7.6l5.4-3.1c5-3 9.9-6.3 14.6-9.8c7.6-5.7 10.1-15.7 7.1-24.7l-9.3-28.2c8.8-10.7 16-23 20.9-36.2l29.1-6.1c9.3-1.9 16.7-9.1 17.8-18.5c.8-6.7 1.2-13.5 1.2-20.4s-.4-13.7-1.2-20.4c-1.1-9.4-8.6-16.6-17.8-18.5L583.9 307c-5-13.3-12.1-25.5-20.9-36.2l9.3-28.2c3-9 .5-19-7.1-24.7c-4.7-3.5-9.6-6.8-14.6-9.9l-5.3-3c-5-2.8-10.2-5.3-15.6-7.6c-8.7-3.7-18.6-.9-25 6.2l-19.8 22.2c-6.8-1.1-13.8-1.7-20.9-1.7s-14.1 .6-20.9 1.7l-19.8-22.2c-6.3-7.1-16.2-9.9-25-6.2c-5.3 2.3-10.5 4.8-15.6 7.6l-5.2 3c-5.1 3-9.9 6.3-14.6 9.9c-7.6 5.7-10.1 15.7-7.1 24.7l9.3 28.2c-8.8 10.7-16 23-20.9 36.2L315.1 313c-9.3 1.9-16.7 9.1-17.8 18.5c-.8 6.7-1.2 13.5-1.2 20.4s.4 13.7 1.2 20.4c1.1 9.4 8.6 16.6 17.8 18.5l29.1 6.1c5 13.3 12.1 25.5 20.9 36.2l-9.3 28.2c-3 9-.5 19 7.1 24.7c4.7 3.5 9.5 6.8 14.6 9.8l5.4 3.1c5 2.8 10.2 5.3 15.5 7.6c8.7 3.7 18.6 .9 25-6.2l19.8-22.2c6.8 1.1 13.8 1.7 20.9 1.7s14.1-.6 20.9-1.7l19.8 22.2zM464 400c-26.5 0-48-21.5-48-48s21.5-48 48-48s48 21.5 48 48s-21.5 48-48 48z"/></svg> - filter data based selected inputs - render filtered table ] .pull-right[ ***What to do*** - Draw the reactive graph for the user inputs and server outputs ] <div class="countdown" id="timer_35a00681" data-update-every="1" tabindex="0" style="right:0;bottom:0;margin:1em;"> <div class="countdown-controls"><button class="countdown-bump-down">−</button><button class="countdown-bump-up">+</button></div> <code class="countdown-time"><span class="countdown-digits minutes">05</span><span class="countdown-digits colon">:</span><span class="countdown-digits seconds">00</span></code> </div> --- # Minimal Shiny App: building the app .pull-left[ ***Data*** <svg aria-hidden="true" role="img" viewBox="0 0 448 512" style="height:1em;width:0.88em;vertical-align:-0.125em;margin-left:auto;margin-right:auto;font-size:inherit;fill:currentColor;overflow:visible;position:relative;"><path d="M448 80v48c0 44.2-100.3 80-224 80S0 172.2 0 128V80C0 35.8 100.3 0 224 0S448 35.8 448 80zM393.2 214.7c20.8-7.4 39.9-16.9 54.8-28.6V288c0 44.2-100.3 80-224 80S0 332.2 0 288V186.1c14.9 11.8 34 21.2 54.8 28.6C99.7 230.7 159.5 240 224 240s124.3-9.3 169.2-25.3zM0 346.1c14.9 11.8 34 21.2 54.8 28.6C99.7 390.7 159.5 400 224 400s124.3-9.3 169.2-25.3c20.8-7.4 39.9-16.9 54.8-28.6V432c0 44.2-100.3 80-224 80S0 476.2 0 432V346.1z"/></svg> - bird density <svg aria-hidden="true" role="img" viewBox="0 0 512 512" style="height:1em;width:1em;vertical-align:-0.125em;margin-left:auto;margin-right:auto;font-size:inherit;fill:currentColor;overflow:visible;position:relative;"><path d="M470.6 105.4c12.5 12.5 12.5 32.8 0 45.3l-256 256c-12.5 12.5-32.8 12.5-45.3 0l-128-128c-12.5-12.5-12.5-32.8 0-45.3s32.8-12.5 45.3 0L192 338.7 425.4 105.4c12.5-12.5 32.8-12.5 45.3 0z"/></svg> ***layout*** (ui) <svg aria-hidden="true" role="img" viewBox="0 0 576 512" style="height:1em;width:1.12em;vertical-align:-0.125em;margin-left:auto;margin-right:auto;font-size:inherit;fill:currentColor;overflow:visible;position:relative;"><path d="M160 256C160 185.3 217.3 128 288 128C358.7 128 416 185.3 416 256C416 326.7 358.7 384 288 384C217.3 384 160 326.7 160 256zM288 336C332.2 336 368 300.2 368 256C368 211.8 332.2 176 288 176C287.3 176 286.7 176 285.1 176C287.3 181.1 288 186.5 288 192C288 227.3 259.3 256 224 256C218.5 256 213.1 255.3 208 253.1C208 254.7 208 255.3 208 255.1C208 300.2 243.8 336 288 336L288 336zM95.42 112.6C142.5 68.84 207.2 32 288 32C368.8 32 433.5 68.84 480.6 112.6C527.4 156 558.7 207.1 573.5 243.7C576.8 251.6 576.8 260.4 573.5 268.3C558.7 304 527.4 355.1 480.6 399.4C433.5 443.2 368.8 480 288 480C207.2 480 142.5 443.2 95.42 399.4C48.62 355.1 17.34 304 2.461 268.3C-.8205 260.4-.8205 251.6 2.461 243.7C17.34 207.1 48.62 156 95.42 112.6V112.6zM288 80C222.8 80 169.2 109.6 128.1 147.7C89.6 183.5 63.02 225.1 49.44 256C63.02 286 89.6 328.5 128.1 364.3C169.2 402.4 222.8 432 288 432C353.2 432 406.8 402.4 447.9 364.3C486.4 328.5 512.1 286 526.6 256C512.1 225.1 486.4 183.5 447.9 147.7C406.8 109.6 353.2 80 288 80V80z"/></svg> - side panel: user inputs <svg aria-hidden="true" role="img" viewBox="0 0 512 512" style="height:1em;width:1em;vertical-align:-0.125em;margin-left:auto;margin-right:auto;font-size:inherit;fill:currentColor;overflow:visible;position:relative;"><path d="M470.6 105.4c12.5 12.5 12.5 32.8 0 45.3l-256 256c-12.5 12.5-32.8 12.5-45.3 0l-128-128c-12.5-12.5-12.5-32.8 0-45.3s32.8-12.5 45.3 0L192 338.7 425.4 105.4c12.5-12.5 32.8-12.5 45.3 0z"/></svg> - main panel: server outputs <svg aria-hidden="true" role="img" viewBox="0 0 512 512" style="height:1em;width:1em;vertical-align:-0.125em;margin-left:auto;margin-right:auto;font-size:inherit;fill:currentColor;overflow:visible;position:relative;"><path d="M470.6 105.4c12.5 12.5 12.5 32.8 0 45.3l-256 256c-12.5 12.5-32.8 12.5-45.3 0l-128-128c-12.5-12.5-12.5-32.8 0-45.3s32.8-12.5 45.3 0L192 338.7 425.4 105.4c12.5-12.5 32.8-12.5 45.3 0z"/></svg> ***user inputs*** (ui) <svg aria-hidden="true" role="img" viewBox="0 0 576 512" style="height:1em;width:1.12em;vertical-align:-0.125em;margin-left:auto;margin-right:auto;font-size:inherit;fill:currentColor;overflow:visible;position:relative;"><path d="M160 256C160 185.3 217.3 128 288 128C358.7 128 416 185.3 416 256C416 326.7 358.7 384 288 384C217.3 384 160 326.7 160 256zM288 336C332.2 336 368 300.2 368 256C368 211.8 332.2 176 288 176C287.3 176 286.7 176 285.1 176C287.3 181.1 288 186.5 288 192C288 227.3 259.3 256 224 256C218.5 256 213.1 255.3 208 253.1C208 254.7 208 255.3 208 255.1C208 300.2 243.8 336 288 336L288 336zM95.42 112.6C142.5 68.84 207.2 32 288 32C368.8 32 433.5 68.84 480.6 112.6C527.4 156 558.7 207.1 573.5 243.7C576.8 251.6 576.8 260.4 573.5 268.3C558.7 304 527.4 355.1 480.6 399.4C433.5 443.2 368.8 480 288 480C207.2 480 142.5 443.2 95.42 399.4C48.62 355.1 17.34 304 2.461 268.3C-.8205 260.4-.8205 251.6 2.461 243.7C17.34 207.1 48.62 156 95.42 112.6V112.6zM288 80C222.8 80 169.2 109.6 128.1 147.7C89.6 183.5 63.02 225.1 49.44 256C63.02 286 89.6 328.5 128.1 364.3C169.2 402.4 222.8 432 288 432C353.2 432 406.8 402.4 447.9 364.3C486.4 328.5 512.1 286 526.6 256C512.1 225.1 486.4 183.5 447.9 147.7C406.8 109.6 353.2 80 288 80V80z"/></svg> - select input: species - select input: periods ***server output*** <svg aria-hidden="true" role="img" viewBox="0 0 640 512" style="height:1em;width:1.25em;vertical-align:-0.125em;margin-left:auto;margin-right:auto;font-size:inherit;fill:currentColor;overflow:visible;position:relative;"><path d="M308.5 135.3c7.1-6.3 9.9-16.2 6.2-25c-2.3-5.3-4.8-10.5-7.6-15.5L304 89.4c-3-5-6.3-9.9-9.8-14.6c-5.7-7.6-15.7-10.1-24.7-7.1l-28.2 9.3c-10.7-8.8-23-16-36.2-20.9L199 27.1c-1.9-9.3-9.1-16.7-18.5-17.8C173.7 8.4 166.9 8 160 8s-13.7 .4-20.4 1.2c-9.4 1.1-16.6 8.6-18.5 17.8L115 56.1c-13.3 5-25.5 12.1-36.2 20.9L50.5 67.8c-9-3-19-.5-24.7 7.1c-3.5 4.7-6.8 9.6-9.9 14.6l-3 5.3c-2.8 5-5.3 10.2-7.6 15.6c-3.7 8.7-.9 18.6 6.2 25l22.2 19.8C32.6 161.9 32 168.9 32 176s.6 14.1 1.7 20.9L11.5 216.7c-7.1 6.3-9.9 16.2-6.2 25c2.3 5.3 4.8 10.5 7.6 15.6l3 5.2c3 5.1 6.3 9.9 9.9 14.6c5.7 7.6 15.7 10.1 24.7 7.1l28.2-9.3c10.7 8.8 23 16 36.2 20.9l6.1 29.1c1.9 9.3 9.1 16.7 18.5 17.8c6.7 .8 13.5 1.2 20.4 1.2s13.7-.4 20.4-1.2c9.4-1.1 16.6-8.6 18.5-17.8l6.1-29.1c13.3-5 25.5-12.1 36.2-20.9l28.2 9.3c9 3 19 .5 24.7-7.1c3.5-4.7 6.8-9.5 9.8-14.6l3.1-5.4c2.8-5 5.3-10.2 7.6-15.5c3.7-8.7 .9-18.6-6.2-25l-22.2-19.8c1.1-6.8 1.7-13.8 1.7-20.9s-.6-14.1-1.7-20.9l22.2-19.8zM208 176c0 26.5-21.5 48-48 48s-48-21.5-48-48s21.5-48 48-48s48 21.5 48 48zM504.7 500.5c6.3 7.1 16.2 9.9 25 6.2c5.3-2.3 10.5-4.8 15.5-7.6l5.4-3.1c5-3 9.9-6.3 14.6-9.8c7.6-5.7 10.1-15.7 7.1-24.7l-9.3-28.2c8.8-10.7 16-23 20.9-36.2l29.1-6.1c9.3-1.9 16.7-9.1 17.8-18.5c.8-6.7 1.2-13.5 1.2-20.4s-.4-13.7-1.2-20.4c-1.1-9.4-8.6-16.6-17.8-18.5L583.9 307c-5-13.3-12.1-25.5-20.9-36.2l9.3-28.2c3-9 .5-19-7.1-24.7c-4.7-3.5-9.6-6.8-14.6-9.9l-5.3-3c-5-2.8-10.2-5.3-15.6-7.6c-8.7-3.7-18.6-.9-25 6.2l-19.8 22.2c-6.8-1.1-13.8-1.7-20.9-1.7s-14.1 .6-20.9 1.7l-19.8-22.2c-6.3-7.1-16.2-9.9-25-6.2c-5.3 2.3-10.5 4.8-15.6 7.6l-5.2 3c-5.1 3-9.9 6.3-14.6 9.9c-7.6 5.7-10.1 15.7-7.1 24.7l9.3 28.2c-8.8 10.7-16 23-20.9 36.2L315.1 313c-9.3 1.9-16.7 9.1-17.8 18.5c-.8 6.7-1.2 13.5-1.2 20.4s.4 13.7 1.2 20.4c1.1 9.4 8.6 16.6 17.8 18.5l29.1 6.1c5 13.3 12.1 25.5 20.9 36.2l-9.3 28.2c-3 9-.5 19 7.1 24.7c4.7 3.5 9.5 6.8 14.6 9.8l5.4 3.1c5 2.8 10.2 5.3 15.5 7.6c8.7 3.7 18.6 .9 25-6.2l19.8-22.2c6.8 1.1 13.8 1.7 20.9 1.7s14.1-.6 20.9-1.7l19.8 22.2zM464 400c-26.5 0-48-21.5-48-48s21.5-48 48-48s48 21.5 48 48s-21.5 48-48 48z"/></svg> - filter data based selected inputs - render filtered table ] .pull-right[ ***What to do*** - In side panel: - Add user input for species - Add user input for periods .font80[<svg aria-hidden="true" role="img" viewBox="0 0 192 512" style="height:1em;width:0.38em;vertical-align:-0.125em;margin-left:auto;margin-right:auto;font-size:inherit;fill:currentColor;overflow:visible;position:relative;"><path d="M144 80c0 26.5-21.5 48-48 48s-48-21.5-48-48s21.5-48 48-48s48 21.5 48 48zM0 224c0-17.7 14.3-32 32-32H96c17.7 0 32 14.3 32 32V448h32c17.7 0 32 14.3 32 32s-14.3 32-32 32H32c-17.7 0-32-14.3-32-32s14.3-32 32-32H64V256H32c-17.7 0-32-14.3-32-32z"/></svg> [here](https://shiny.rstudio.com/gallery/widget-gallery.html) for control widgets] ] <div class="countdown" id="timer_6510127a" data-update-every="1" tabindex="0" style="right:0;bottom:0;margin:1em;"> <div class="countdown-controls"><button class="countdown-bump-down">−</button><button class="countdown-bump-up">+</button></div> <code class="countdown-time"><span class="countdown-digits minutes">10</span><span class="countdown-digits colon">:</span><span class="countdown-digits seconds">00</span></code> </div> --- # Minimal Shiny App: building the app .pull-left[ ***Data*** <svg aria-hidden="true" role="img" viewBox="0 0 448 512" style="height:1em;width:0.88em;vertical-align:-0.125em;margin-left:auto;margin-right:auto;font-size:inherit;fill:currentColor;overflow:visible;position:relative;"><path d="M448 80v48c0 44.2-100.3 80-224 80S0 172.2 0 128V80C0 35.8 100.3 0 224 0S448 35.8 448 80zM393.2 214.7c20.8-7.4 39.9-16.9 54.8-28.6V288c0 44.2-100.3 80-224 80S0 332.2 0 288V186.1c14.9 11.8 34 21.2 54.8 28.6C99.7 230.7 159.5 240 224 240s124.3-9.3 169.2-25.3zM0 346.1c14.9 11.8 34 21.2 54.8 28.6C99.7 390.7 159.5 400 224 400s124.3-9.3 169.2-25.3c20.8-7.4 39.9-16.9 54.8-28.6V432c0 44.2-100.3 80-224 80S0 476.2 0 432V346.1z"/></svg> - bird density <svg aria-hidden="true" role="img" viewBox="0 0 512 512" style="height:1em;width:1em;vertical-align:-0.125em;margin-left:auto;margin-right:auto;font-size:inherit;fill:currentColor;overflow:visible;position:relative;"><path d="M470.6 105.4c12.5 12.5 12.5 32.8 0 45.3l-256 256c-12.5 12.5-32.8 12.5-45.3 0l-128-128c-12.5-12.5-12.5-32.8 0-45.3s32.8-12.5 45.3 0L192 338.7 425.4 105.4c12.5-12.5 32.8-12.5 45.3 0z"/></svg> ***layout*** (ui) <svg aria-hidden="true" role="img" viewBox="0 0 576 512" style="height:1em;width:1.12em;vertical-align:-0.125em;margin-left:auto;margin-right:auto;font-size:inherit;fill:currentColor;overflow:visible;position:relative;"><path d="M160 256C160 185.3 217.3 128 288 128C358.7 128 416 185.3 416 256C416 326.7 358.7 384 288 384C217.3 384 160 326.7 160 256zM288 336C332.2 336 368 300.2 368 256C368 211.8 332.2 176 288 176C287.3 176 286.7 176 285.1 176C287.3 181.1 288 186.5 288 192C288 227.3 259.3 256 224 256C218.5 256 213.1 255.3 208 253.1C208 254.7 208 255.3 208 255.1C208 300.2 243.8 336 288 336L288 336zM95.42 112.6C142.5 68.84 207.2 32 288 32C368.8 32 433.5 68.84 480.6 112.6C527.4 156 558.7 207.1 573.5 243.7C576.8 251.6 576.8 260.4 573.5 268.3C558.7 304 527.4 355.1 480.6 399.4C433.5 443.2 368.8 480 288 480C207.2 480 142.5 443.2 95.42 399.4C48.62 355.1 17.34 304 2.461 268.3C-.8205 260.4-.8205 251.6 2.461 243.7C17.34 207.1 48.62 156 95.42 112.6V112.6zM288 80C222.8 80 169.2 109.6 128.1 147.7C89.6 183.5 63.02 225.1 49.44 256C63.02 286 89.6 328.5 128.1 364.3C169.2 402.4 222.8 432 288 432C353.2 432 406.8 402.4 447.9 364.3C486.4 328.5 512.1 286 526.6 256C512.1 225.1 486.4 183.5 447.9 147.7C406.8 109.6 353.2 80 288 80V80z"/></svg> - side panel: user inputs <svg aria-hidden="true" role="img" viewBox="0 0 512 512" style="height:1em;width:1em;vertical-align:-0.125em;margin-left:auto;margin-right:auto;font-size:inherit;fill:currentColor;overflow:visible;position:relative;"><path d="M470.6 105.4c12.5 12.5 12.5 32.8 0 45.3l-256 256c-12.5 12.5-32.8 12.5-45.3 0l-128-128c-12.5-12.5-12.5-32.8 0-45.3s32.8-12.5 45.3 0L192 338.7 425.4 105.4c12.5-12.5 32.8-12.5 45.3 0z"/></svg> - main panel: server outputs <svg aria-hidden="true" role="img" viewBox="0 0 512 512" style="height:1em;width:1em;vertical-align:-0.125em;margin-left:auto;margin-right:auto;font-size:inherit;fill:currentColor;overflow:visible;position:relative;"><path d="M470.6 105.4c12.5 12.5 12.5 32.8 0 45.3l-256 256c-12.5 12.5-32.8 12.5-45.3 0l-128-128c-12.5-12.5-12.5-32.8 0-45.3s32.8-12.5 45.3 0L192 338.7 425.4 105.4c12.5-12.5 32.8-12.5 45.3 0z"/></svg> ***user inputs*** (ui) <svg aria-hidden="true" role="img" viewBox="0 0 576 512" style="height:1em;width:1.12em;vertical-align:-0.125em;margin-left:auto;margin-right:auto;font-size:inherit;fill:currentColor;overflow:visible;position:relative;"><path d="M160 256C160 185.3 217.3 128 288 128C358.7 128 416 185.3 416 256C416 326.7 358.7 384 288 384C217.3 384 160 326.7 160 256zM288 336C332.2 336 368 300.2 368 256C368 211.8 332.2 176 288 176C287.3 176 286.7 176 285.1 176C287.3 181.1 288 186.5 288 192C288 227.3 259.3 256 224 256C218.5 256 213.1 255.3 208 253.1C208 254.7 208 255.3 208 255.1C208 300.2 243.8 336 288 336L288 336zM95.42 112.6C142.5 68.84 207.2 32 288 32C368.8 32 433.5 68.84 480.6 112.6C527.4 156 558.7 207.1 573.5 243.7C576.8 251.6 576.8 260.4 573.5 268.3C558.7 304 527.4 355.1 480.6 399.4C433.5 443.2 368.8 480 288 480C207.2 480 142.5 443.2 95.42 399.4C48.62 355.1 17.34 304 2.461 268.3C-.8205 260.4-.8205 251.6 2.461 243.7C17.34 207.1 48.62 156 95.42 112.6V112.6zM288 80C222.8 80 169.2 109.6 128.1 147.7C89.6 183.5 63.02 225.1 49.44 256C63.02 286 89.6 328.5 128.1 364.3C169.2 402.4 222.8 432 288 432C353.2 432 406.8 402.4 447.9 364.3C486.4 328.5 512.1 286 526.6 256C512.1 225.1 486.4 183.5 447.9 147.7C406.8 109.6 353.2 80 288 80V80z"/></svg> - select input: species <svg aria-hidden="true" role="img" viewBox="0 0 512 512" style="height:1em;width:1em;vertical-align:-0.125em;margin-left:auto;margin-right:auto;font-size:inherit;fill:currentColor;overflow:visible;position:relative;"><path d="M470.6 105.4c12.5 12.5 12.5 32.8 0 45.3l-256 256c-12.5 12.5-32.8 12.5-45.3 0l-128-128c-12.5-12.5-12.5-32.8 0-45.3s32.8-12.5 45.3 0L192 338.7 425.4 105.4c12.5-12.5 32.8-12.5 45.3 0z"/></svg> - select input: periods <svg aria-hidden="true" role="img" viewBox="0 0 512 512" style="height:1em;width:1em;vertical-align:-0.125em;margin-left:auto;margin-right:auto;font-size:inherit;fill:currentColor;overflow:visible;position:relative;"><path d="M470.6 105.4c12.5 12.5 12.5 32.8 0 45.3l-256 256c-12.5 12.5-32.8 12.5-45.3 0l-128-128c-12.5-12.5-12.5-32.8 0-45.3s32.8-12.5 45.3 0L192 338.7 425.4 105.4c12.5-12.5 32.8-12.5 45.3 0z"/></svg> ***server output*** <svg aria-hidden="true" role="img" viewBox="0 0 640 512" style="height:1em;width:1.25em;vertical-align:-0.125em;margin-left:auto;margin-right:auto;font-size:inherit;fill:currentColor;overflow:visible;position:relative;"><path d="M308.5 135.3c7.1-6.3 9.9-16.2 6.2-25c-2.3-5.3-4.8-10.5-7.6-15.5L304 89.4c-3-5-6.3-9.9-9.8-14.6c-5.7-7.6-15.7-10.1-24.7-7.1l-28.2 9.3c-10.7-8.8-23-16-36.2-20.9L199 27.1c-1.9-9.3-9.1-16.7-18.5-17.8C173.7 8.4 166.9 8 160 8s-13.7 .4-20.4 1.2c-9.4 1.1-16.6 8.6-18.5 17.8L115 56.1c-13.3 5-25.5 12.1-36.2 20.9L50.5 67.8c-9-3-19-.5-24.7 7.1c-3.5 4.7-6.8 9.6-9.9 14.6l-3 5.3c-2.8 5-5.3 10.2-7.6 15.6c-3.7 8.7-.9 18.6 6.2 25l22.2 19.8C32.6 161.9 32 168.9 32 176s.6 14.1 1.7 20.9L11.5 216.7c-7.1 6.3-9.9 16.2-6.2 25c2.3 5.3 4.8 10.5 7.6 15.6l3 5.2c3 5.1 6.3 9.9 9.9 14.6c5.7 7.6 15.7 10.1 24.7 7.1l28.2-9.3c10.7 8.8 23 16 36.2 20.9l6.1 29.1c1.9 9.3 9.1 16.7 18.5 17.8c6.7 .8 13.5 1.2 20.4 1.2s13.7-.4 20.4-1.2c9.4-1.1 16.6-8.6 18.5-17.8l6.1-29.1c13.3-5 25.5-12.1 36.2-20.9l28.2 9.3c9 3 19 .5 24.7-7.1c3.5-4.7 6.8-9.5 9.8-14.6l3.1-5.4c2.8-5 5.3-10.2 7.6-15.5c3.7-8.7 .9-18.6-6.2-25l-22.2-19.8c1.1-6.8 1.7-13.8 1.7-20.9s-.6-14.1-1.7-20.9l22.2-19.8zM208 176c0 26.5-21.5 48-48 48s-48-21.5-48-48s21.5-48 48-48s48 21.5 48 48zM504.7 500.5c6.3 7.1 16.2 9.9 25 6.2c5.3-2.3 10.5-4.8 15.5-7.6l5.4-3.1c5-3 9.9-6.3 14.6-9.8c7.6-5.7 10.1-15.7 7.1-24.7l-9.3-28.2c8.8-10.7 16-23 20.9-36.2l29.1-6.1c9.3-1.9 16.7-9.1 17.8-18.5c.8-6.7 1.2-13.5 1.2-20.4s-.4-13.7-1.2-20.4c-1.1-9.4-8.6-16.6-17.8-18.5L583.9 307c-5-13.3-12.1-25.5-20.9-36.2l9.3-28.2c3-9 .5-19-7.1-24.7c-4.7-3.5-9.6-6.8-14.6-9.9l-5.3-3c-5-2.8-10.2-5.3-15.6-7.6c-8.7-3.7-18.6-.9-25 6.2l-19.8 22.2c-6.8-1.1-13.8-1.7-20.9-1.7s-14.1 .6-20.9 1.7l-19.8-22.2c-6.3-7.1-16.2-9.9-25-6.2c-5.3 2.3-10.5 4.8-15.6 7.6l-5.2 3c-5.1 3-9.9 6.3-14.6 9.9c-7.6 5.7-10.1 15.7-7.1 24.7l9.3 28.2c-8.8 10.7-16 23-20.9 36.2L315.1 313c-9.3 1.9-16.7 9.1-17.8 18.5c-.8 6.7-1.2 13.5-1.2 20.4s.4 13.7 1.2 20.4c1.1 9.4 8.6 16.6 17.8 18.5l29.1 6.1c5 13.3 12.1 25.5 20.9 36.2l-9.3 28.2c-3 9-.5 19 7.1 24.7c4.7 3.5 9.5 6.8 14.6 9.8l5.4 3.1c5 2.8 10.2 5.3 15.5 7.6c8.7 3.7 18.6 .9 25-6.2l19.8-22.2c6.8 1.1 13.8 1.7 20.9 1.7s14.1-.6 20.9-1.7l19.8 22.2zM464 400c-26.5 0-48-21.5-48-48s21.5-48 48-48s48 21.5 48 48s-21.5 48-48 48z"/></svg> - filter data based selected inputs - render filtered table ] .pull-right[ ***What to do*** - Create reactive expression to filter table based on user inputs - Add table output in main panel .font80[<svg aria-hidden="true" role="img" viewBox="0 0 192 512" style="height:1em;width:0.38em;vertical-align:-0.125em;margin-left:auto;margin-right:auto;font-size:inherit;fill:currentColor;overflow:visible;position:relative;"><path d="M144 80c0 26.5-21.5 48-48 48s-48-21.5-48-48s21.5-48 48-48s48 21.5 48 48zM0 224c0-17.7 14.3-32 32-32H96c17.7 0 32 14.3 32 32V448h32c17.7 0 32 14.3 32 32s-14.3 32-32 32H32c-17.7 0-32-14.3-32-32s14.3-32 32-32H64V256H32c-17.7 0-32-14.3-32-32z"/></svg> [here](https://shiny.rstudio.com/tutorial/written-tutorial/lesson6/) for more information on reactive expressions] .font80[<svg aria-hidden="true" role="img" viewBox="0 0 192 512" style="height:1em;width:0.38em;vertical-align:-0.125em;margin-left:auto;margin-right:auto;font-size:inherit;fill:currentColor;overflow:visible;position:relative;"><path d="M144 80c0 26.5-21.5 48-48 48s-48-21.5-48-48s21.5-48 48-48s48 21.5 48 48zM0 224c0-17.7 14.3-32 32-32H96c17.7 0 32 14.3 32 32V448h32c17.7 0 32 14.3 32 32s-14.3 32-32 32H32c-17.7 0-32-14.3-32-32s14.3-32 32-32H64V256H32c-17.7 0-32-14.3-32-32z"/></svg> [here](https://shiny.rstudio.com/tutorial/written-tutorial/lesson4/) for more on displaying reactive outputs] ] <div class="countdown" id="timer_378e0564" data-update-every="1" tabindex="0" style="right:0;bottom:0;margin:1em;"> <div class="countdown-controls"><button class="countdown-bump-down">−</button><button class="countdown-bump-up">+</button></div> <code class="countdown-time"><span class="countdown-digits minutes">20</span><span class="countdown-digits colon">:</span><span class="countdown-digits seconds">00</span></code> </div> --- # Solution 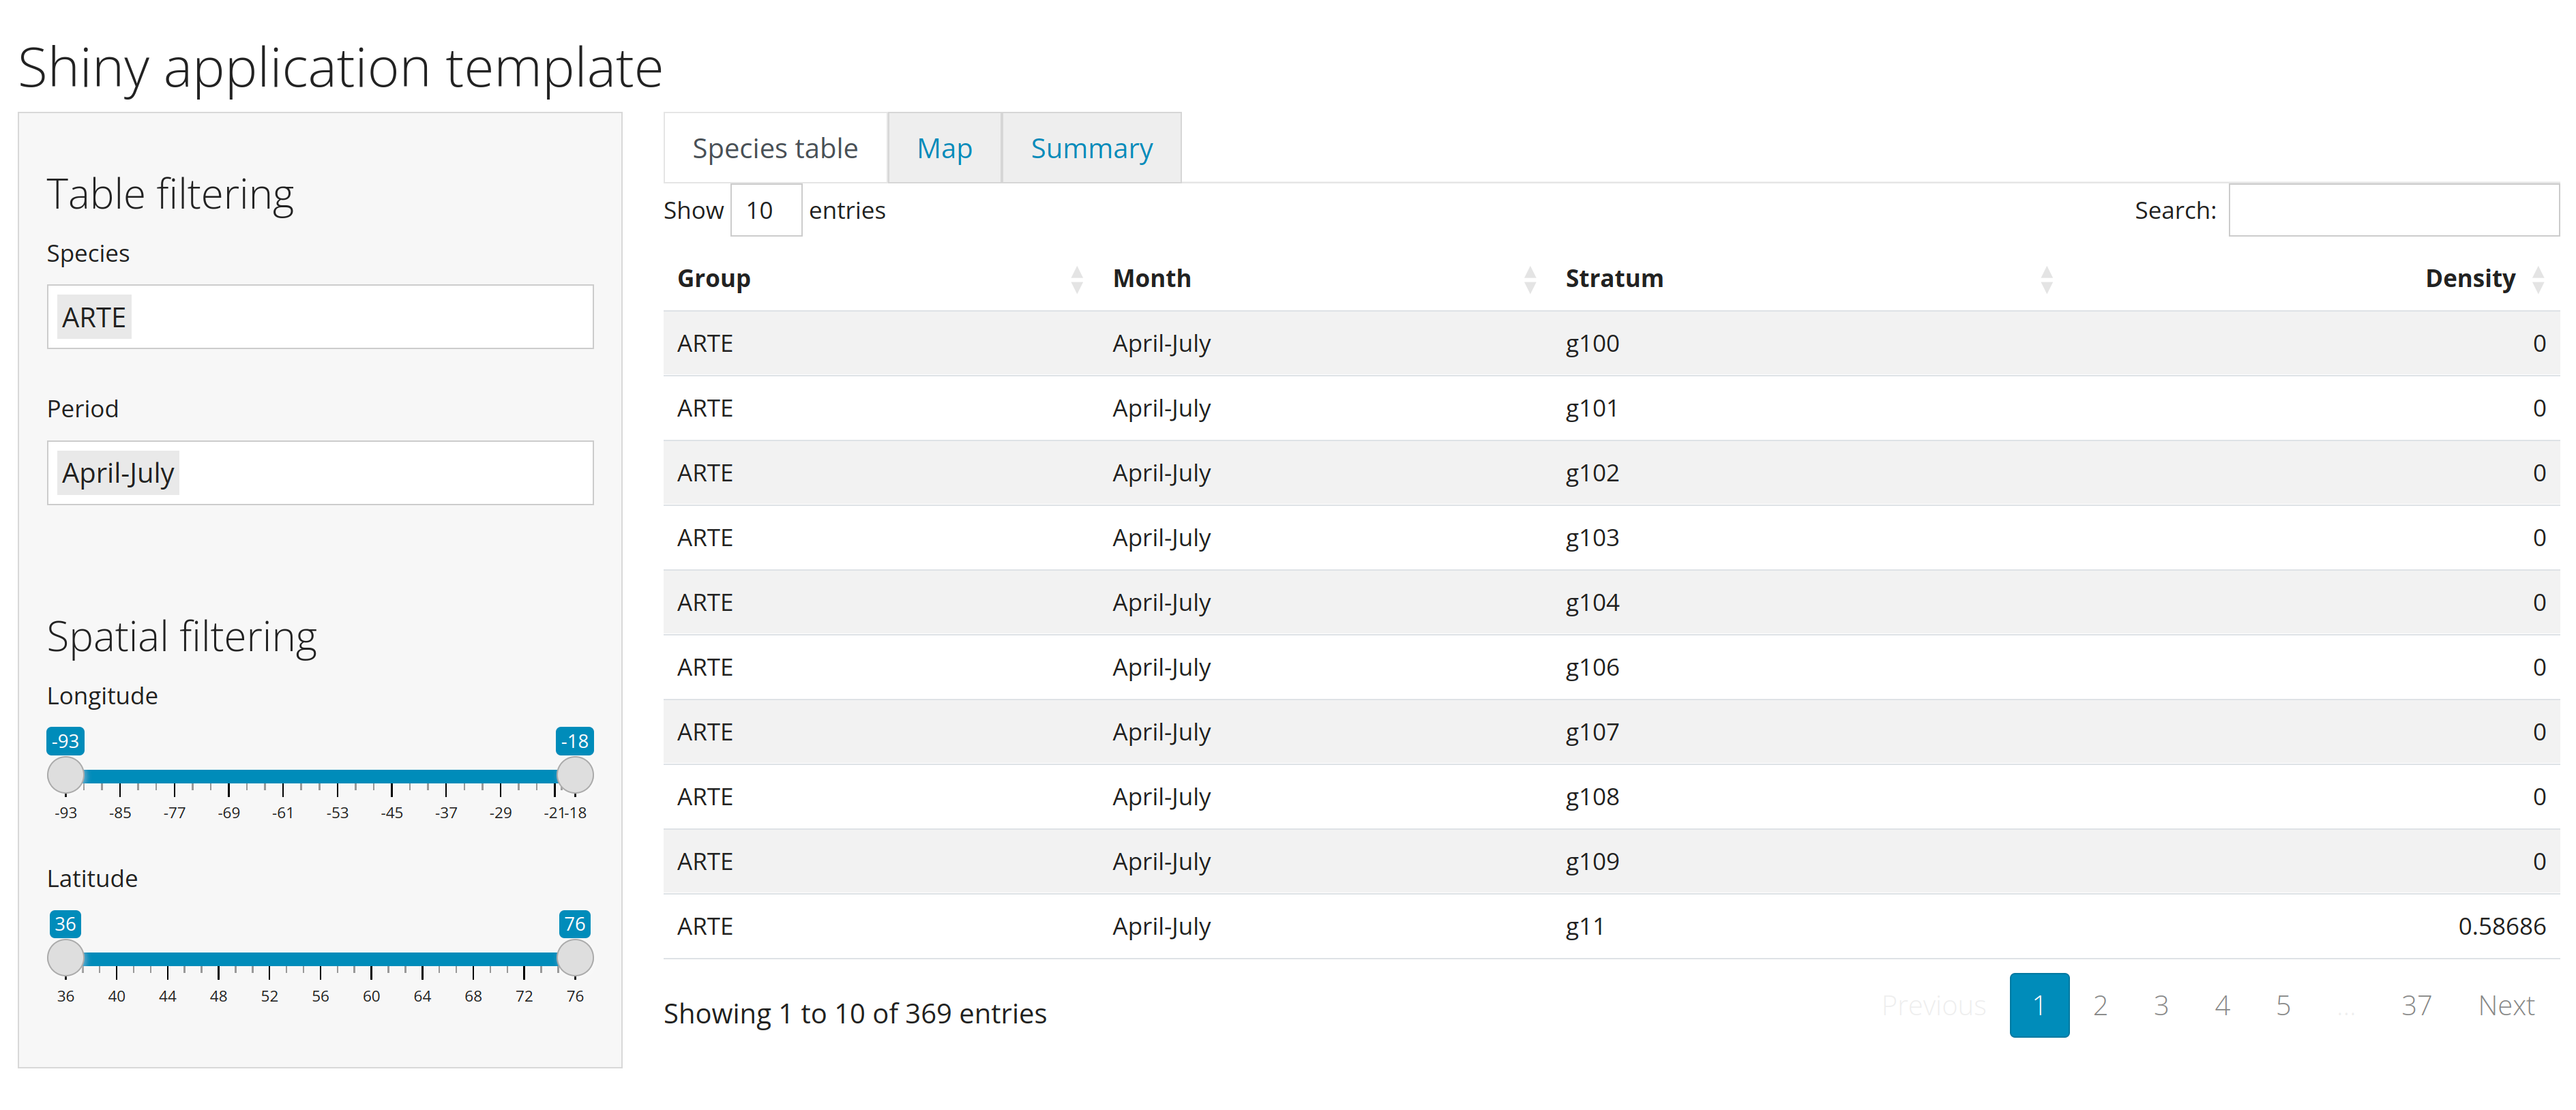 https://github.com/inSilecoInc/cws-shiny-template/blob/practice1/practice1/app.R --- # Pipes `|>` | `%>%` The pipe operators `|>` (`|` + `>`) (native R) or %>% (using `magrittr`) are a chained method that lets you pass an intermediate result to the next function. -- .pull-left[ ```r # Example with pipe operator dat <- dplyr::filter( densities, Group %in% input$species ) |> dplyr::select(Group) ``` ] .pull-right[ ```r # Example without pipe operator dat <- dplyr::filter( densities, Group %in% input$species ) dat <- dplyr::select(dat, Group) ``` ] .font70[`%>%` is similar to the `+` operator used by `ggplot2`] .font70[See [here](https://www.datacamp.com/community/tutorials/pipe-r-tutorial) for a full description of the history and use of pipes. ]